Reference Architecture: Deploying a vision-language model with vLLM on OVHcloud MKS for high performance inference and full observability
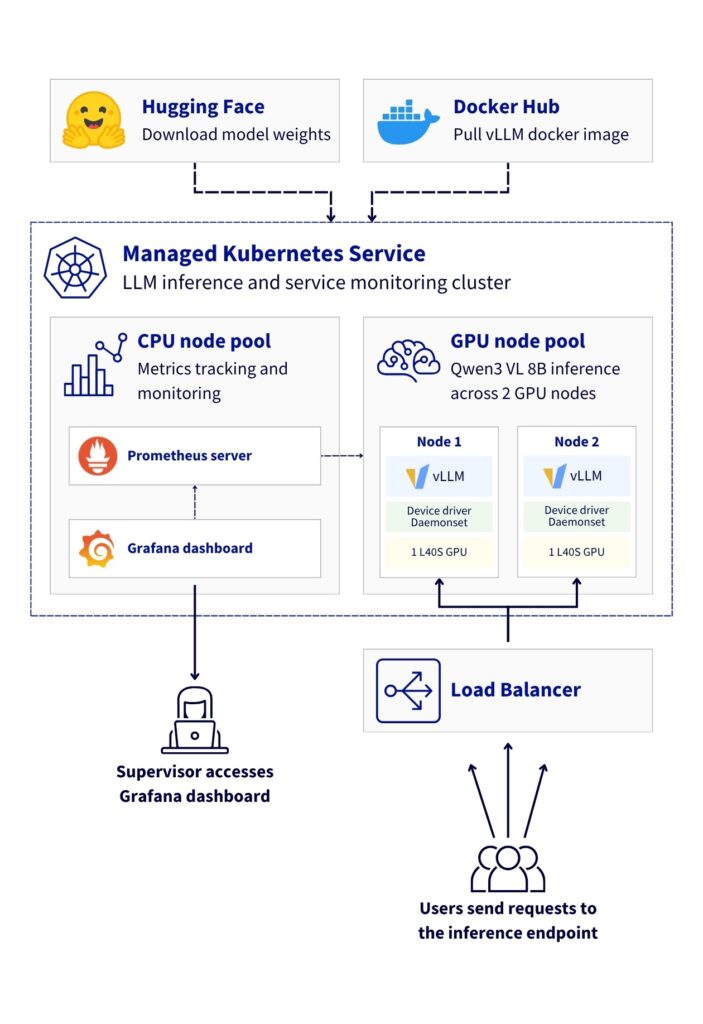
Ensure complete digital sovereignty of your AI models with end-to-end control through open-source solutions on OVHcloud’s Managed Kubernetes Service.
This reference architecture demonstrates how to deploy a Large Language Model (LLM) inference system using vLLM on OVHcloud Managed Kubernetes Service (MKS). The solution leverages NVIDIA L40S GPUs to serve the Qwen3-VL-8B-Instruct multimodal model (vision + text) with OpenAI-compatible API endpoints.
This comprehensive guide shows you how to deploy, to scale automatically, and how to monitor vLLM-based LLM workloads on the OVHcloud infrastructure.
What are the key benefits?
- Cost-effectiveness: Leverage managed services to minimise operational overhead
- Real-time observability: Track Time-to-First-Token (TTFT), throughput, and resource utilisation
- Sovereign infrastructure: Keep all metrics and data within European datacentres
- Scalable by design: Automatically scale GPU inference replicas based on real workload demand
Context
Managed Kubernetes Service
OVHcloud MKS is a fully managed Kubernetes platform designed to help you deploy, operate, and scale containerised applications in production. It provides a secure and reliable Kubernetes environment without the operational overhead of managing the control plane.
How does this benefit you?
- Cost-efficient: Pay only for worker nodes and consumed resources, with no additional charge for the Kubernetes control plane
- Fully managed Kubernetes: Certified upstream Kubernetes with automated control plane management, provided upgrades and high availability
- Production-ready by design: Built-in integrations with OVHcloud Load Balancers, networking, and persistent storage
- Scalable and flexible: Scale workloads easily, node pools to match application demand
- Open and portable: Based on standard Kubernetes APIs, enable seamless integration with open-source ecosystems and avoid vendor lock-in
In the following guide, all services are deployed within the OVHcloud Public Cloud.
Architecture overview
This reference architecture demonstrates a basic deployment of vLLM for vision-language model inference on OVHcloud Managed Kubernetes Service, featuring:
- High-availability deployment with 2 GPU nodes (NVIDIA L40S)
- Optimised GPU utilisation with proper driver configuration
- Scalable infrastructure supporting vision-language models
- Comprehensive monitoring using Prometheus, Grafana, and DCGM
- Full observability for both application and hardware metrics
Data flow:
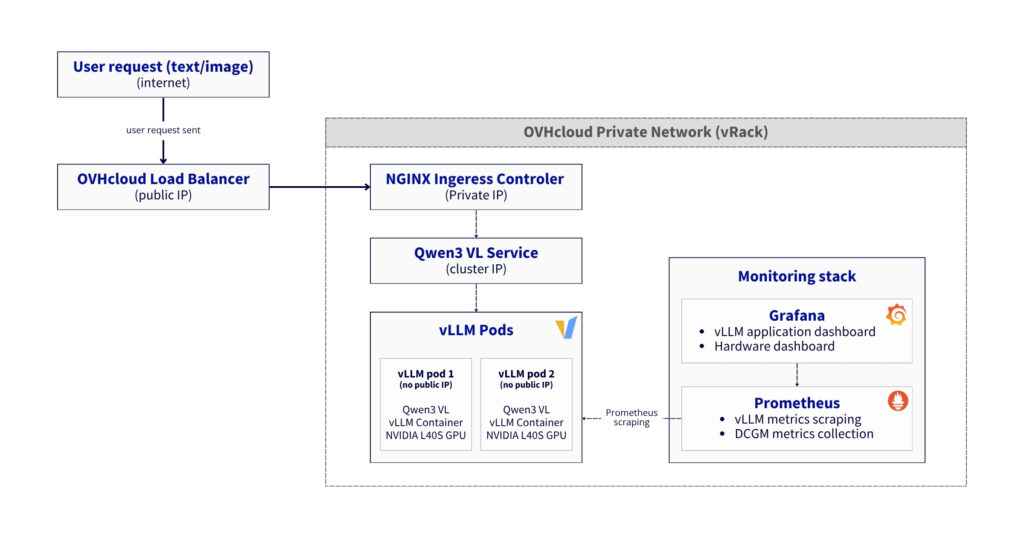
- User → LoadBalancer → Gateway → NGINX Ingress → "Qwen3 VL" Service → vLLM Pod → GPU
- Response follows reverse path with streaming support
Prerequisites
Before you begin, ensure you have:
- An OVHcloud Public Cloud account
- An OpenStack user with the
Administratorrole - Hugging Face access – create a Hugging Face account and generate an access token
kubectlalready installed andhelminstalled (at least version 3.x)
🚀 Now you have all the ingredients, it’s time to deploy the recipe for Qwen/Qwen3-VL-8B-Instruct using vLLM and MKS!
Architecture guide: Native GPU deployment of vLLM on MKS with full stack observability
This reference architecture describes a Large Language Model deployment using vLLM inference server and Kubernetes, to enjoy the benefits of a service that's both highly available and monitorable in real time.
Step 1 - Create MKS cluster and Node pools
From OVHcloud Control Panel, create a Kubernetes cluster using the MKS.
Navigate to: Public Cloud → Managed Kubernetes Service → Create a cluster
1. Configure cluster
Consider using the following configuration for the current use case:
- Name:
vllm-deployment-l40s-qwen3-8b - Location: 1-AZ Region - Gravelines (
GRA11) - Plan: Free (or Standard)
- Network: attach a Private network (e.g.
0000 - AI Private Network) - Version: Latest stable (e.g.
1.34)
2. Create GPU Node pool
During the cluster creation, configure the vLLM Node pool for GPUs:
- Node pool name:
vllm - Flavor:
L40S-90 - Number of nodes:
2 - Autoscaling: Disabled (OFF)
Why L40S-90?
- Cost-effective for single-model deployment (1 GPU per node)
- Sufficient RAM (90GB) for
Qwen3-VL-8Bmodel
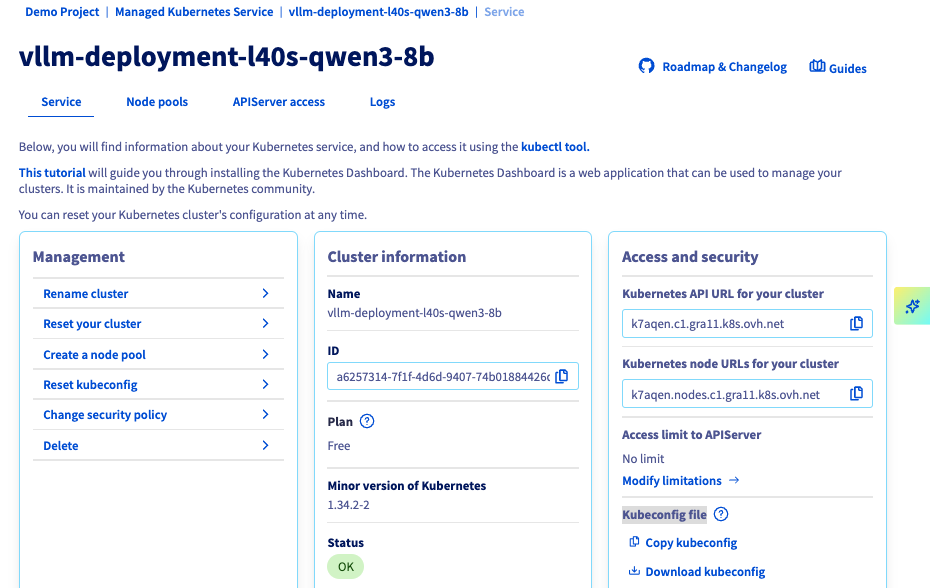
You should see your cluster (e.g. vllm-deployment-l40s-qwen3-8b) in the list, along with the following information:
You can now set up the node pool dedicated to monitoring.
3. Create CPU Node pool
From your cluster, click on Add a node pool and configure it as follow:
- Node pool name:
monitoring - Flavor:
B2-15 - Number of nodes:
1 - Autoscaling: Disabled (OFF)
✅ Note
Monitoring stack can run on GPU nodes if cost is a concern. Dedicated CPU node provides better isolation and resource management.
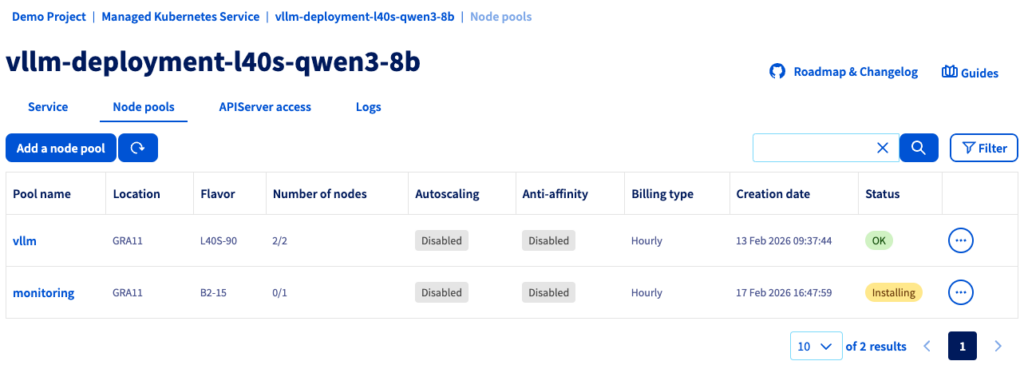
If the status is green with the OK label, you can proceed to the next step.
4. Configure Kubernetes access
Once your nodes have been provisioned, you can download the Kubeconfig file and configure kubectl with your MKS cluster.
# configure kubectl with your MKS cluster
export KUBECONFIG=/path/to/your/kubeconfig-xxxxxx.yml

# verify cluster connectivity
kubectl cluster-info
kubectl get nodes
Returning:
NAME STATUS ROLES AGE VERSIONmonitoring-node-xxxxxx Ready <none> 1d v1.34.2vllm-node-yyyyyy Ready <none> 1d v1.34.2vllm-node-zzzzzz Ready <none> 1d v1.34.2
Before going further, add a label to the CPU node for monitoring workloads.
CPU_NODE=$(kubectl get nodes -o json | \
  jq -r '.items[] | select(.status.allocatable."nvidia.com/gpu" == null) | .metadata.name')
kubectl label node $CPU_NODE node-role=monitoring
Finally, check with the following command:
NAME                     GPU      ROLE
monitoring-node-xxxxxx   <none>   monitoring
vllm-node-yyyyyy         1        <none>
vllm-node-zzzzzz         1        <none>
Once both nodes are in Ready status, you can proceed to the next step.
Step 2 - Install GPU operator
To start, consider setting up the GPU operator.
✅ Note
This step is based on this OVHcloud documentation: Deploying a GPU application on OVHcloud Managed Kubernetes Service
1. Add NVIDIA helm repository and create namespace
Add NVIDIA helm repo:
helm repo add nvidia https://helm.ngc.nvidia.com/nvidia
helm repo update
And create Namespace as follow.
kubectl create namespace gpu-operator2. Install GPU operator with correct configuration
The GPU Operator must be configured with specific driver versions to ensure compatibility with vLLM containers.
However, the default installation uses recent drivers (580.x with CUDA 13.x) which are incompatible with vLLM containers (CUDA 12.x).
Solution: Force driver version 535.183.01 (CUDA 12.2).
helm install gpu-operator nvidia/gpu-operator \
  -n gpu-operator \
  --set driver.enabled=true \
  --set driver.version="535.183.01" \
  --set toolkit.enabled=true \
  --set operator.defaultRuntime=containerd \
  --set devicePlugin.enabled=true \
  --set dcgmExporter.enabled=true \
  --set dcgmExporter.image="dcgm-exporter" \
  --set dcgmExporter.version="3.1.7-3.1.4-ubuntu20.04" \
  --set gfd.enabled=true \
  --set migManager.enabled=false \
  --set nodeStatusExporter.enabled=true \
  --set validator.driver.enable=false \
  --set validator.toolkit.enable=false \
  --set validator.plugin.enable=false \
  --timeout 20m
✅ Note
Specifying the DCGM version may only be necessary if you encounter problems with the default image (e.g.
‘ImagePullBackOff’). If this is the case, add the following parameters:--set dcgmExporter.repository="nvcr.io/nvidia/k8s"--set dcgmExporter.image="dcgm-exporter"--set dcgmExporter.version="3.1.7-3.1.4-ubuntu20.04"
kubectl get pods -n gpu-operatorNote that all pods should reach Running state in 5-10 minutes.
You can also check the GPU availability:
kubectl get nodes -o json | jq -r '.items[] | select(.status.allocatable."nvidia.com/gpu" != null) | "\(.metadata.name): \(.status.allocatable."nvidia.com/gpu") GPU(s)"'Returning:
vllm-node-yyyyyy: 1 GPU(s)vllm-node-zzzzzz: 1 GPU(s)
And you can test to run nvidia-smi:
DRIVER_POD=$(kubectl get pods -n gpu-operator -l app=nvidia-driver-daemonset -o name | head -1)
kubectl exec -n gpu-operator $DRIVER_POD -- nvidia-smi
If GPU tests are working properly, you can move on DCGM service configuration.
3. Configure DCGM service
Why is DCGM Exporter required?
DCGM (Data Centre GPU Manager) is NVIDIA's official tool for monitoring GPUs in production. The goal is to be able to collect and display metrics from both GPU nodes.
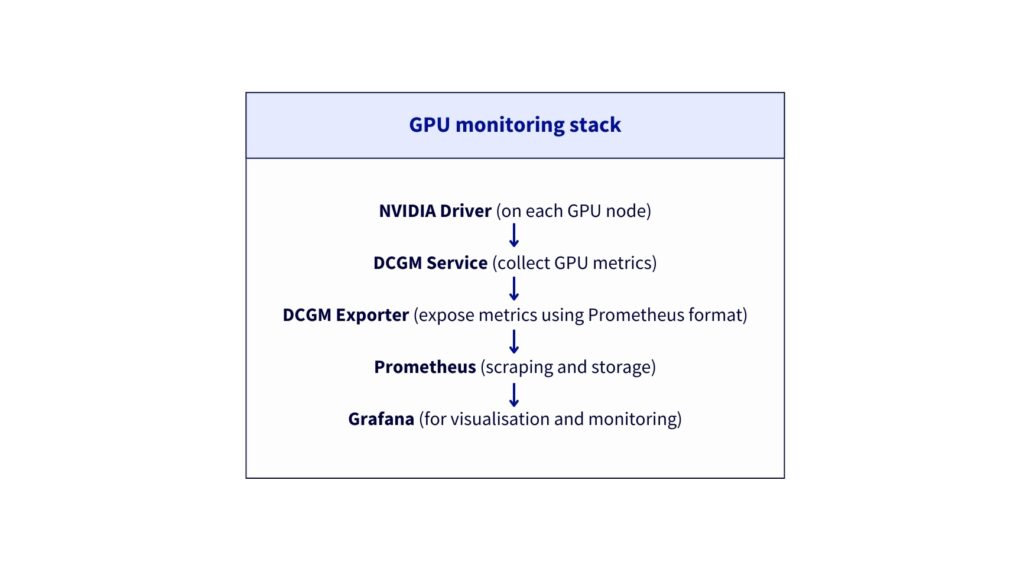
The metrics provided are:
DCGM_FI_DEV_GPU_UTIL- GPU utilisation (%)DCGM_FI_DEV_GPU_TEMP- GPU temperature (°C)DCGM_FI_DEV_FB_USED- VRAM used (MB)DCGM_FI_DEV_FB_FREE- Free VRAM (MB)DCGM_FI_DEV_POWER_USAGE- Power consumption (W)- And 50+ other GPU metrics
Next, ensure DCGM service has the correct labels and port configuration:
kubectl patch svc nvidia-dcgm-exporter -n gpu-operator --type merge -p '{
  "metadata": {
    "labels": {
      "app": "nvidia-dcgm-exporter"
    }
  },
  "spec": {
    "ports": [
      {
        "name": "metrics",
        "port": 9400,
        "targetPort": 9400,
        "protocol": "TCP"
      }
    ]
  }
}'
Verify the endpoints (should show 2 IPs, one per GPU node).
kubectl get endpoints nvidia-dcgm-exporter -n gpu-operatorNAME ENDPOINTS AGEnvidia-dcgm-exporter x.x.x.x:9400,x.x.x.x:9400 17d
Step 3 - Deploy Qwen3 VL 8B with vLLM inference server
The deployment of the Qwen 3 VL 8B model on two L40S GPU nodes is carried out in several stages.
1. Create namespace and Hugging Face secret
Start by creating Namespace:
kubectl create namespace vllmNext, you must retrieve your Hugging Face token and replace the HF_TOKEN value by your own:
export HF_TOKEN="hf_xxxxxxxxxxxxxxxxxxxxxxxxxxxxxxxx"Create your secret as follow:
kubectl create secret generic huggingface-secret \
  --from-literal=token=$HF_TOKEN \
  --namespace=vllm
Verify you obtain the following output by launching:
kubectl get secret huggingface-secret -n vllmNAME TYPE DATA AGEhuggingface-secret Opaque 1 14d
2. Create vLLM deployment configuration
First, you can create vllm-deployment-2nodes.yaml file.
Deploy vLLM:
kubectl apply -f vllm-deployment-2nodes.yamlYou can monitor the deployment (it should take 8-10 minutes for model download and loading).
kubectl get pods -n vllm -o wide -wExpected output after 10 minutes:
NAME               READY  STATUS   RESTARTS  AGE  IP       NODE
qwen3-vl-xxxx-yyy  1/1    Running  0         1d   X.X.X.X  vllm-node-yyyyyy
qwen3-vl-xxxx-zzz  1/1    Running  0         1d   X.X.X.X  vllm-node-zzzzzz
You can also check the container logs:
kubectl logs -f -n vllm <pod-name>You should find in the logs: "Uvicorn running on http://0.0.0.0:8000"
Is everything installed correctly? Then let's move on to the next step.
3. Add service label
Ensure service has the correct label for ServiceMonitor discovery.
kubectl label svc qwen3-vl-service -n vllm app=qwen3-vl --overwriteYou can now verify by launching the following command.
kubectl get svc qwen3-vl-service -n vllm --show-labels | grep "app=qwen3-vl"Returning:
qwen3-vl-service ClusterIP X.X.X.X <none> 8000/TCP 1d app=qwen3-vl
Step 4 - Install NGINX ingress controller
⚠️ Moving beyond Ingress
Follow this tutorial if you want to use Gateway instead of Ingress.
1. Add helm repository and configure Ingress
First of all, add helm repository:
helm repo add ingress-nginx https://kubernetes.github.io/ingress-nginx
helm repo update
Create configuration file with ingress-nginx-values.yaml.
Then, install NGINX Ingress:
helm install ingress-nginx ingress-nginx/ingress-nginx \
  --namespace ingress-nginx \
  --create-namespace \
  -f ingress-nginx-values.yaml \
  --wait
Wait for LoadBalancer IP. The external IP assignment should take 1-2 minutes.
kubectl get svc -n ingress-nginx ingress-nginx-controller -wOnce <EXTERNAL-IP> is no longer , Ctrl+C and export it:
export EXTERNAL_IP=<EXTERNAL-IP>
echo "API URL: http://$EXTERNAL_IP"
2. Create vLLM Ingress resource
Next, create vLLM Ingress using vllm-ingress.yaml.
Apply it as follow:
kubectl apply -f vllm-ingress.yamlYou can now test different API calls to verify that your deployment is functional.
3. Test API
Firstly, check if the model is available:
curl http://$EXTERNAL_IP/v1/models | jq{
"object": "list",
"data": [
{
"id": "qwen3-vl-8b",
"object": "model",
"created": 1772472143,
"owned_by": "vllm",
"root": "Qwen/Qwen3-VL-8B-Instruct",
"parent": null,
"max_model_len": 8192,
"permission": [
{
"id": "modelperm-8fb35cdd3208b068",
"object": "model_permission",
"created": 1772472143,
"allow_create_engine": false,
"allow_sampling": true,
"allow_logprobs": true,
"allow_search_indices": false,
"allow_view": true,
"allow_fine_tuning": false,
"organization": "*",
"group": null,
"is_blocking": false
}
]
}
]
}Next, test inference using the following request:
curl http://$EXTERNAL_IP/v1/chat/completions \
  -H "Content-Type: application/json" \
  -d '{
    "model": "qwen3-vl-8b",
    "messages": [{"role": "user", "content": "Count from 1 to 10."}],
    "max_tokens": 100
  }' | jq '.choices[0].message.content'
"1, 2, 3, 4, 5, 6, 7, 8, 9, 10"
Great! You're almost there…
Step 5 - Install Prometheus stack
Now, set up the monitoring stack that provides complete observability for application-level (vLLM) and hardware-level (GPU) metrics:
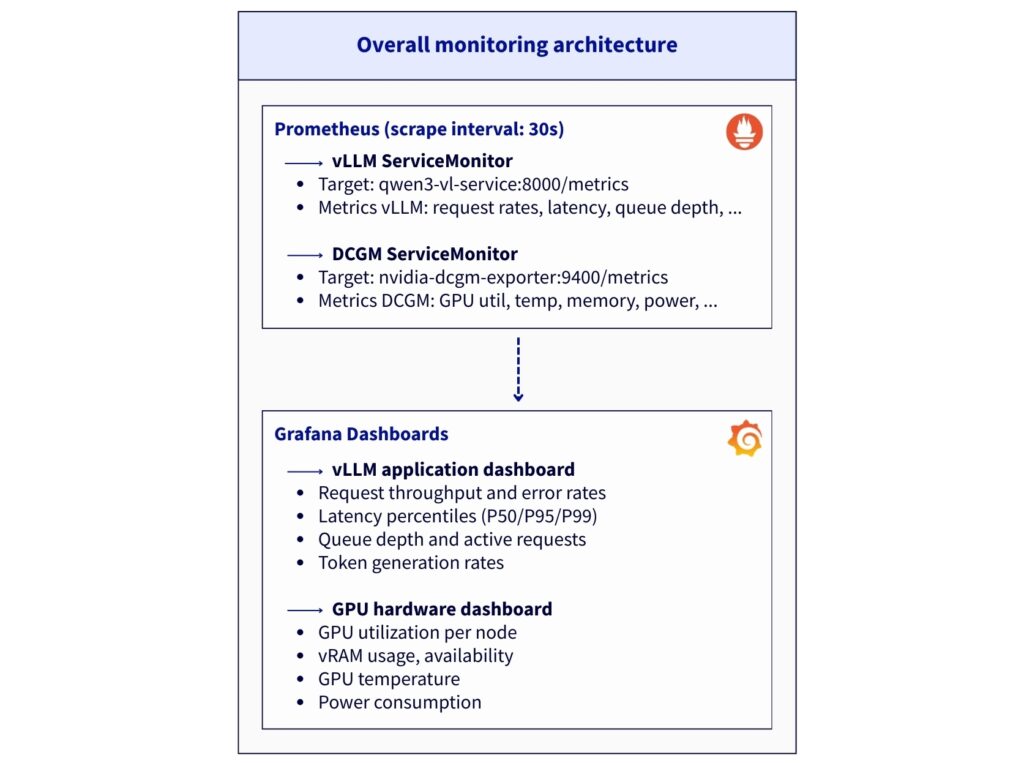
1. Add helm repository and create namespace
Add Prometheus helm repo:
helm repo add prometheus-community https://prometheus-community.github.io/helm-charts
helm repo update
Then, create the monitoring Namespace.
kubectl create namespace monitoring2. Create Prometheus deployment configuration and installation
First, create prometheus.yaml file.
Install Prometheus stack:
helm install prometheus prometheus-community/kube-prometheus-stack \
  -n monitoring \
  -f prometheus.yaml \
  --timeout 10m \
  --wait
Now, monitor its installation and wait until the pods are ready:
kubectl get pods -n monitoring -wIf all pods are running successfully, you can proceed to the next step.
3. Check that the installation is operational
First access Grafana in background:
kubectl port-forward -n monitoring svc/prometheus-grafana 3000:80 &Test Grafana health:
curl -s http://localhost:3000/api/health | jq{
"database": "ok",
"version": "12.3.3",
"commit": "2a14494b2d6ab60f860d8b27603d0ccb264336f6"
}You can now access to Grafana locally via http://localhost:3000. You will have to use:
- Login:
admin - Password:
Admin123!vLLM
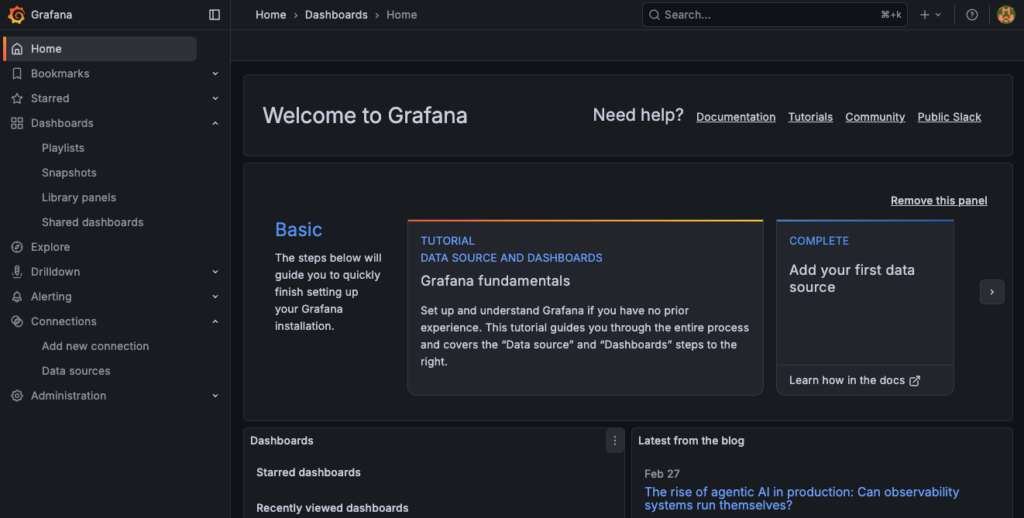
Well done! You can now proceed to the configuration step.
Step 6 - Configure ServiceMonitors
The ServiceMonitors is used to tell Prometheus which endpoints to scrape for metrics.
1. Create vLLM ServiceMonitor
Retrieve the file from the GitHub repository: vllm-servicemonitor.yaml.
Next, apply and check that the ServiceMonitor vllm-metrics exists:
kubectl apply -f vllm-servicemonitor.yaml
kubectl get servicemonitor -n vllm
2. Create DCGM ServiceMonitor
First, create the dcgm-servicemonitor.yaml file.
Once again, apply and verify:
kubectl apply -f dcgm-servicemonitor.yaml
kubectl get servicemonitor -n gpu-operatorgpu-operator 1d
nvidia-dcgm-exporter 1d
nvidia-node-status-exporter 1d3. Configure Prometheus for Cross-Namespace discovery
Apply a patch to allow Prometheus to discover ServiceMonitors in all namespaces.
kubectl patch prometheus prometheus-kube-prometheus-prometheus -n monitoring --type merge -p '{
  "spec": {
    "serviceMonitorNamespaceSelector": {},
    "podMonitorNamespaceSelector": {}
  }
}'
Now you have to restart Prometheus.
- Delete Prometheus pod to force configuration reload
- Wait for Prometheus to restart
kubectl delete pod prometheus-prometheus-kube-prometheus-prometheus-0 -n monitoring

kubectl wait --for=condition=Ready \
  pod/prometheus-prometheus-kube-prometheus-prometheus-0 \
  -n monitoring \
  --timeout=180s
Wait about 2 minutes for discovery and finally, verify targets:
kubectl port-forward -n monitoring \
  prometheus-prometheus-kube-prometheus-prometheus-0 9090:9090 &
You can open in browser: http://localhost:9090/targets and search for:
vllmdcgm
Note that the expected targets are:
- serviceMonitor/vllm/vllm-metrics/0 (2/2 UP)
- serviceMonitor/gpu-operator/nvidia-dcgm-exporter/0 (2/2 UP)
Step 7 - Create Grafana dashboards
In this final step, the goal is to create two Grafana dashboards to track both the software side with vLLM metrics and the hardware metrics that will monitor the GPU consumption and system.
1. vLLM application metrics
The dashboard provides insights into vLLM application performance, request handling, and resource utilization based on the following metrics:
| Type | Unit | Metric | Description | Dashboard Usage |
|---|---|---|---|---|
| Counter | count | vllm:request_success_total | Total successful requests | Request Rate, Total Requests |
| Gauge | count | vllm:num_requests_running | Requests currently being processed | Queue Depth, Active Requests |
| Gauge | count | vllm:num_requests_waiting | Requests waiting in queue | Queue Depth, Queued Requests |
| Histogram | seconds | vllm:time_to_first_token_seconds | Latency until first token generated | TTFT P50/P95/P99 |
| Histogram | seconds | vllm:e2e_request_latency_seconds | Total end-to-end latency | E2E Latency P50/P95/P99 |
| Counter | count | vllm:generation_tokens_total | Total tokens generated (output) | Token Generation Rate, Throughput |
| Counter | count | vllm:prompt_tokens_total | Total prompt tokens (input) | Token Generation Rate, Avg Tokens |
| Gauge | 0-1 (0-100%) | vllm:kv_cache_usage_perc | GPU KV cache utilization | KV Cache Usage |
| Counter | count | vllm:prefix_cache_hits_total | Number of prefix cache hits | Cache Hit Rate |
| Counter | count | vllm:prefix_cache_queries_total | Number of prefix cache queries | Cache Hit Rate |
| Histogram | seconds | vllm:request_queue_time_seconds | Time spent waiting in queue | Request Queue Time |
| Histogram | seconds | vllm:request_prefill_time_seconds | Prefill phase time | Prefill Time |
| Histogram | seconds | vllm:request_decode_time_seconds | Decode phase time | Decode Time |
| Histogram | seconds | vllm:inter_token_latency_seconds | Latency between each token | Inter-Token Latency |
| Counter | count | vllm:num_preemptions_total | Number of preemptions (OOM) | Preemptions |
| Counter | count | vllm:prompt_tokens_cached_total | Prompt tokens cached | Cached Tokens |
| Histogram | count | vllm:request_prompt_tokens | Prompt size distribution | (Table) |
| Histogram | count | vllm:request_generation_tokens | Generated tokens distribution | (Table) |
| Histogram | count | vllm:iteration_tokens_total | Tokens per iteration | (Advanced analysis) |
This vLLM Grafana dashboard is composed of 23 panels:
The dashboard provides insights into LLM application performance, request handling, and resource utilisation based on the previous metrics.
| Type | Nombre | Panels |
|---|---|---|
| Timeseries | 12 | Request Rate, Queue Depth, TTFT, E2E Latency, Token Gen, Cache Usage, Cache Hit, Queue Time, Prefill/Decode, Inter-Token, Preemptions, Avg Tokens |
| Stat | 10 | Throughput, TTFT P95, Active Req, Queued Req, Cache Hit Rate, Cache Usage, Total Req, Total Tokens, Cached Tokens, Preemptions |
| Table | 1 | Pod Performance |
Now create the dashboard using vllm-app-dashboard.json. Then, launch:
echo "Importing vLLM application dashboard..."
curl -X POST \
  'http://localhost:3000/api/dashboards/db' \
  -H 'Content-Type: application/json' \
  -u 'admin:Admin123!vLLM' \
  -d @vllm-app-dashboard.json | jq '.status, .url'
Next, you an access the vLLM dashboard and follow metrics in real time:
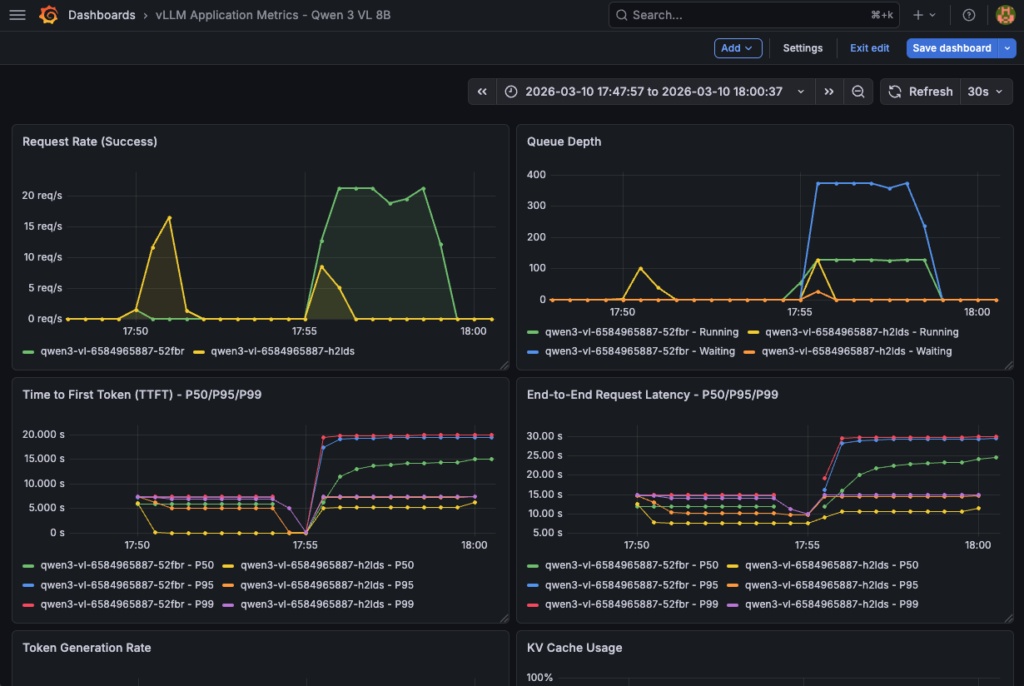
This dashboard is also essential to track hardware consumption for comprehensive monitoring.
2. GPU hardware metrics
Take advantage of the most useful DCGM metrics to check both the functioning and consumption of your hardware resources:
| Type | Unit | Metric | Description | Dashboard Usage | Normal Thresholds |
|---|---|---|---|---|---|
| Gauge | % (0-100) | DCGM_FI_DEV_GPU_UTIL | GPU utilization (compute) | GPU Utilization | 70-95% optimal |
| Gauge | °C | DCGM_FI_DEV_GPU_TEMP | GPU temperature | GPU Temperature | < 85°C normal |
| Gauge | MB | DCGM_FI_DEV_FB_USED | VRAM used | GPU Memory Used | Variable by model |
| Gauge | MB | DCGM_FI_DEV_FB_FREE | VRAM free | GPU Memory Free | > 2GB recommended |
| Gauge | Watts | DCGM_FI_DEV_POWER_USAGE | Power consumption | GPU Power Usage | < 300W (L40S) |
| Gauge | MHz | DCGM_FI_DEV_SM_CLOCK | GPU clock speed (compute) | GPU Clock Speed | Variable |
| Gauge | MHz | DCGM_FI_DEV_MEM_CLOCK | Memory clock speed | Memory Clock Speed | Variable |
| Counter | bytes/s | DCGM_FI_DEV_NVLINK_BANDWIDTH_TOTAL | Total NVLink bandwidth | NVLink Bandwidth | (If multi-GPU) |
| Counter | bytes | DCGM_FI_DEV_PCIE_TX_BYTES | PCIe data transmitted | PCIe TX | (I/O monitoring) |
| Counter | bytes | DCGM_FI_DEV_PCIE_RX_BYTES | PCIe data received | PCIe RX | (I/O monitoring) |
| Counter | count | DCGM_FI_DEV_ECC_DBE_VOL_TOTAL | ECC double-bit errors | (Health check) | 0 ideal |
| Counter | count | DCGM_FI_DEV_ECC_SBE_VOL_TOTAL | ECC single-bit errors | (Health check) | < 10/day acceptable |
This hardware Grafana dashboard is composed of 13 panels with GPU hardware and system metrics. A detailed view is also available GPU util (%), temperature (°C), vRAM (GB) and power (Watt).
| Type | Count | Panels |
|---|---|---|
| Timeseries | 8 | GPU Util, GPU Mem, GPU Temp, GPU Power, CPU Usage, RAM Usage, Network I/O, Disk I/O |
| Stat | 4 | Avg GPU Util, Avg GPU Temp, Total GPU Mem, Total GPU Power |
| Table | 1 | Hardware Status |
Please refer to hardware-dashboard.json by loading it as follows:
echo "Importing hardware dashboard..."
curl -X POST \
  'http://localhost:3000/api/dashboards/db' \
  -H 'Content-Type: application/json' \
  -u 'admin:Admin123!vLLM' \
  -d @hardware-dashboard.json | jq '.status, .url'
Finally, track resource consumption using this hardware dashboard:
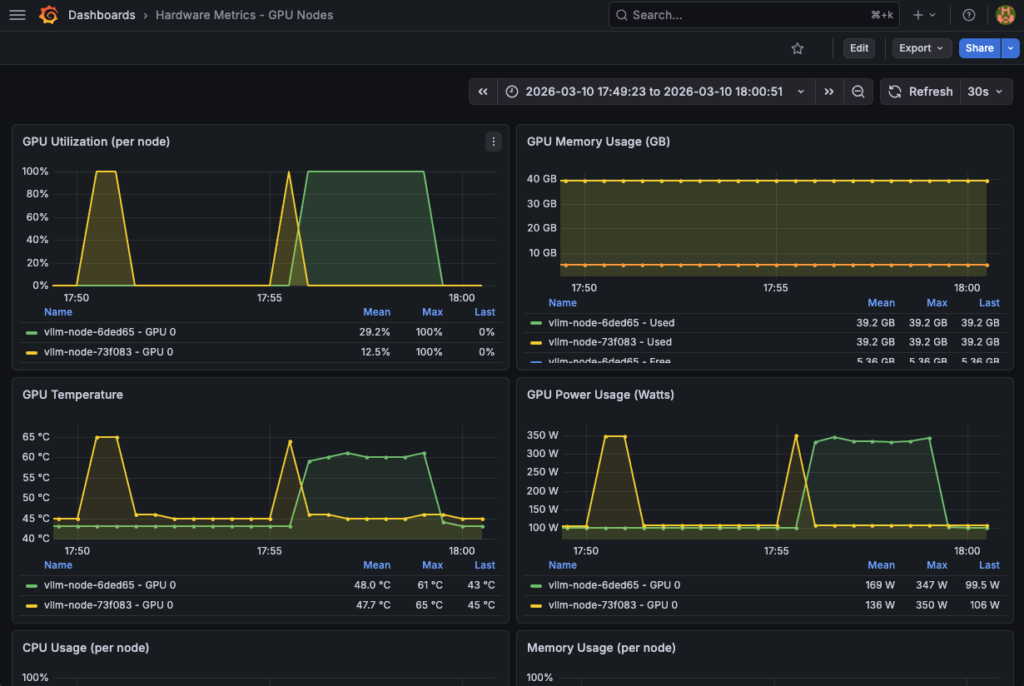
Congratulations! Everything is working. You can now test your model and track the various metrics in real time.
Step 8 - LLM testing and performance tracking
Start by installing Python dependencies:
pip3 install openai tqdmReplace the <EXTERNAL_IP> by the vLLM service external IP and launch the performance test thanks to the following Python code:
import time
import threading
import random
from statistics import mean
from openai import OpenAI
from tqdm import tqdm

APP_URL = "http://94.23.185.22/v1"
MODEL = "qwen3-vl-8b"

CONCURRENT_WORKERS = 500          # concurrency
REQUESTS_PER_WORKER = 10
MAX_TOKENS = 200                  # generation pressure

# some random prompts
SHORT_PROMPTS = [
    "Summarize the theory of relativity.",
    "Explain what a transformer model is.",
    "What is Kubernetes autoscaling?"
]

MEDIUM_PROMPTS = [
    "Explain how attention mechanisms work in transformer-based models, including self-attention and multi-head attention.",
    "Describe how vLLM manages KV cache and why it impacts inference performance."
]

LONG_PROMPTS = [
    "Write a very detailed technical explanation of how large language models perform inference, "
    "including tokenization, embedding lookup, transformer layers, attention computation, KV cache usage, "
    "GPU memory management, and how batching affects latency and throughput. Use examples.",
]

PROMPT_POOL = (
    SHORT_PROMPTS * 2 +
    MEDIUM_PROMPTS * 4 +
    LONG_PROMPTS * 6    # bias toward long prompts
)

# openai compliance
client = OpenAI(
    base_url=APP_URL,
    api_key="foo"
)

# basic metrics
latencies = []
errors = 0
lock = threading.Lock()

# worker
def worker(worker_id):
    global errors
    for _ in range(REQUESTS_PER_WORKER):
        prompt = random.choice(PROMPT_POOL)

        start = time.time()
        try:
            client.chat.completions.create(
                model=MODEL,
                messages=[{"role": "user", "content": prompt}],
                max_tokens=MAX_TOKENS,
                temperature=0.7,
            )
            elapsed = time.time() - start

            with lock:
                latencies.append(elapsed)

        except Exception as e:
            with lock:
                errors += 1

# run
threads = []
start_time = time.time()

print("\n-> STARTING PERFORMANCE TEST:")
print(f"Concurrency: {CONCURRENT_WORKERS}")
print(f"Total requests: {CONCURRENT_WORKERS * REQUESTS_PER_WORKER}")

for i in range(CONCURRENT_WORKERS):
    t = threading.Thread(target=worker, args=(i,))
    t.start()
    threads.append(t)

for t in threads:
    t.join()

total_time = time.time() - start_time

# results
print("\n-> BENCH RESULTS:")
print(f"Total requests sent: {len(latencies) + errors}")
print(f"Successful requests: {len(latencies)}")
print(f"Errors: {errors}")
print(f"Total wall time: {total_time:.2f}s")

if latencies:
    print(f"Avg latency: {mean(latencies):.2f}s")
    print(f"Min latency: {min(latencies):.2f}s")
    print(f"Max latency: {max(latencies):.2f}s")
    print(f"Throughput: {len(latencies)/total_time:.2f} req/s")
Returning:
-> STARTING PERFORMANCE TEST:
Concurrency: 500
Total requests: 5000

-> BENCH RESULTS:
Total requests sent: 5000
Successful requests: 5000
Errors: 0
Total wall time: 225.54s
Avg latency: 21.45s
Min latency: 6.06s
Max latency: 25.19s
Throughput: 22.17 req/s
Don't forget to track GPU and vLLM metrics in your Grafana dashboards!
Conslusion
This reference architecture demonstrates a vLLM deployment on OVHcloud Managed Kubernetes Service (MKS) with comprehensive GPU monitoring. Benefits include:
- High Performance: GPU-accelerated inference with L40S
- Scalability: Kubernetes-native, horizontal scaling-ready
- Reliability: Health checks, auto-restart, monitoring
- API Compatibility: OpenAI-compatible endpoints
- Multimodality: Vision & text capabilities
- Full stack monitoring: Complete vLLM application and hardware dashboards
Going Further
Your current architecture is functional. However, if desired, it could be improved into a full production-ready solution.
Wish to take production hardening a step further?
Go further with the following enhancements:
- vLLM API authentication
- Grafana authentication
- Prometheus security