
Building a real-time data pipeline used to mean months of infrastructure work. Here is what the modern stack looks like in 2026.
Your database is doing its job. It records every transaction, every event, every state change your application produces. The data is reliable, consistent, and safely stored.
But a database is a starting point, not a destination. The question is what happens after the write. Does that data stay in storage, answering application queries, while the insights it could generate stay locked in place? Or does it flow downstream, in real time, to the systems built to make sense of it?
Building that downstream pipeline used to be a serious infrastructure project. Kafka clusters to provision and tune, ZooKeeper ensembles to manage, connectors to configure, sinks to wire up, and a schema registry to operate. A team could spend weeks on the scaffolding before the first event reached an analytics engine.
In 2026, the pipeline architecture has not changed. But the operational weight has. Managed services handle provisioning, replication, failover, and upgrades. What used to take a dedicated platform team now takes an afternoon. This article walks through what a complete real-time data pipeline looks like, how each layer connects, and what it takes to build one without building the infrastructure underneath it.
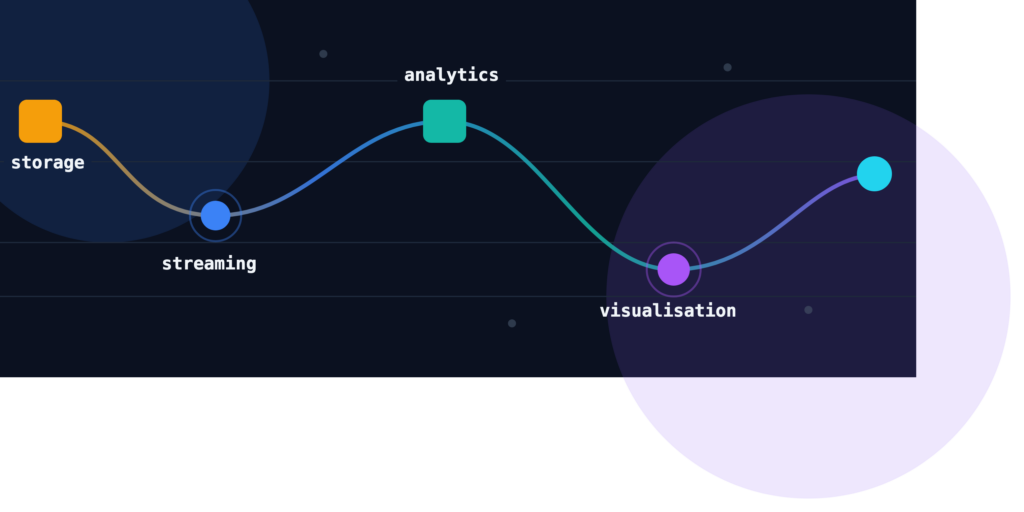
The four layers
A modern real-time data pipeline has four layers. Each has a distinct job, and none of them are optional if you want data to move continuously from storage to insight.
Storage
Where your data originates. A relational database like PostgreSQL handles transactions, enforces consistency, and serves your application. It is your source of truth. Every insert, update, and delete is recorded with precision. That write log is also the starting point for everything downstream.
Streaming
How data moves. Apache Kafka captures changes from your database the moment they happen and distributes them to downstream consumers as events. Every row-level modification becomes a structured message that other systems can act on in real time. Kafka’s core design principle is decoupling: producers write events without knowing who will consume them, and consumers read events without touching the source system. This means you can add new downstream use cases – a new analytics engine, a new alerting system, a new data warehouse – without modifying the database or the application above it.
Analytics
Where data becomes answers. Two distinct engines cover the two main post-storage use cases. ClickHouse handles OLAP workloads: fast columnar queries, real-time aggregations, time-series analysis, and dashboards over millions of rows per second. OpenSearch handles full-text search, log analytics, and observability: complex queries across weeks of event data, anomaly detection, distributed tracing, and alert rules over live event streams. Both engines are designed for reads at scale, not for transactional consistency: this is exactly the trade-off you want after Kafka.
Visualisation
How the answers reach people. Grafana connects to both ClickHouse and OpenSearch, pulling from live data to power dashboards, alert panels, and operational monitors. It is the layer that makes the pipeline visible across the organisation – to the product team checking feature adoption, to the security team watching for anomalies, and the platform team tracking infrastructure health.
Two paths through the same architecture
The topology is consistent regardless of your use case: source database, Kafka as the streaming backbone, one or both analytics engines, and Grafana on top. How you build it depends on what your team needs first.
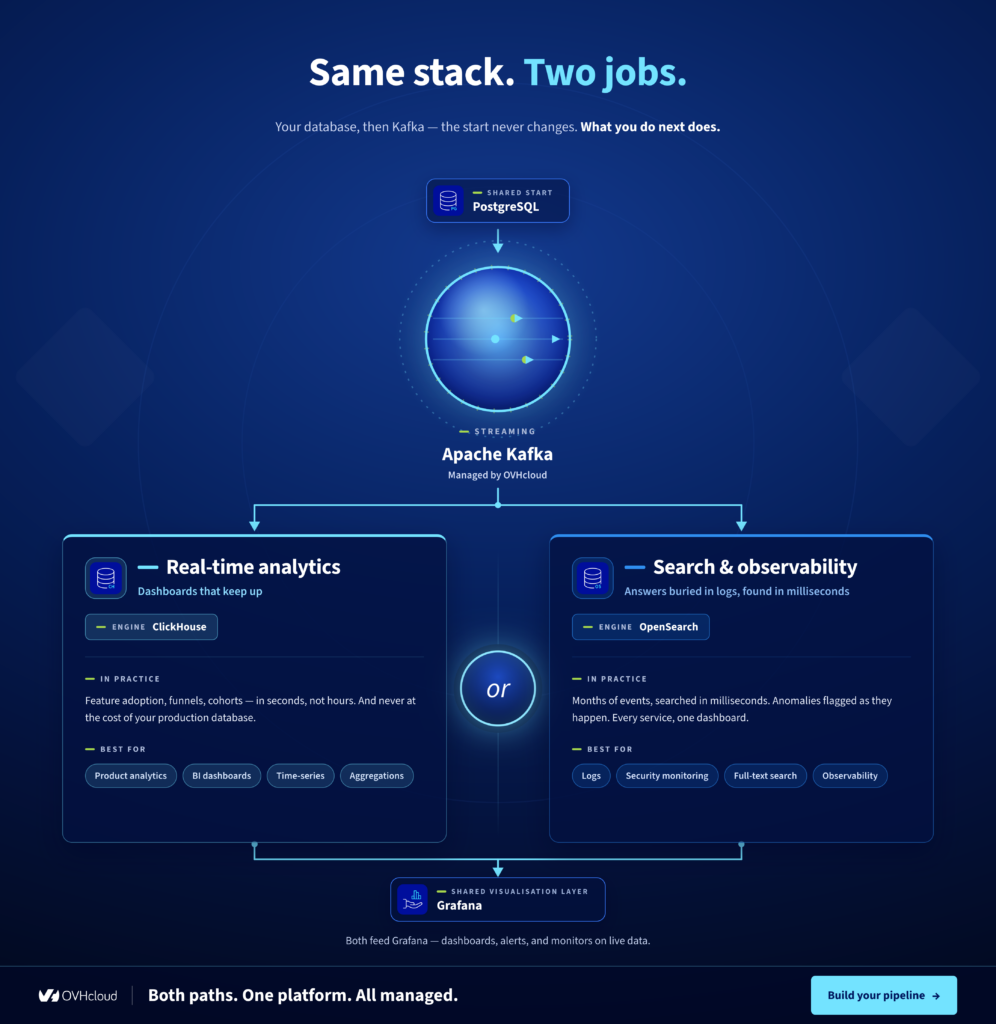
The real-time analytics path
PostgreSQL + Kafka + ClickHouse + Grafana is the right starting point when the primary need is fast, flexible querying. Product analytics, business intelligence, time-series reporting, funnel analysis, A/B test results in real time: these all call for ClickHouse. It ingests directly from Kafka topics, materialises views that dashboards query in milliseconds, and handles aggregations over hundreds of millions of rows without breaking a sweat. The SaaS company that needs to see feature adoption as it happens, the fintech tracking transaction volumes by the minute, the e-commerce platform running live inventory analytics – these all follow this same path.
The search and observability path
PostgreSQL + Kafka + OpenSearch + Grafana is the right starting point when the primary need is full-text search, log aggregation, or system-wide observability. OpenSearch indexes events as they arrive, enabling complex searches across months of structured and semi-structured data with sub-second response times. The security team correlating events across distributed services, the platform team centralising logs from dozens of microservices, the SRE team building alerts on top of live event streams – these all follow this path.
How the data moves
The connection between your database and Kafka starts with change data capture. CDC is the mechanism that reads your database’s internal write log and turns each modification into a stream of structured events.
In PostgreSQL, this works through logical replication. The write-ahead log records every change made to the database, at the row level. With logical replication enabled, a connector can read that log and emit each change as a structured event with the full before and after state of the row. Kafka Connect is the integration layer that runs these connectors. Debezium, configured as a source connector within Kafka Connect, reads the PostgreSQL WAL and publishes each change to a dedicated Kafka topic. From there, sink connectors route events to ClickHouse, OpenSearch, or both.
One technical development worth understanding for anyone building on Kafka in 2026: Kafka 4.0 removes ZooKeeper entirely. ZooKeeper was the external service Kafka relied on to manage cluster metadata, leader election, and coordination. It was a separate system to deploy, configure, monitor, and upgrade alongside the Kafka brokers. Kafka 4.0 replaces it with KRaft, Kafka’s native Raft-based consensus protocol. Cluster metadata is now managed internally by Kafka itself. The result is a single, self-contained system with fewer components, fewer failure modes, and faster recovery. For anyone who operated a Kafka cluster under the ZooKeeper model, this is a material simplification. For anyone running Kafka as a managed service, the transition is mostly invisible: what you get is a faster, more resilient cluster with one less operational surface.
OpenSearch 3.0 is also a meaningful release for anyone building observability pipelines. The upgrade to Apache Lucene 10 delivers up to 60 per cent lower search latency, with the largest gains on vector search, KNN, and neural search workloads. Star-tree indexing reduces query work for heavy aggregations by up to 100 times. And OpenSearch 3.0 adds native MCP protocol support, which means it integrates directly with AI agents and LLM-based tooling. For teams building observability pipelines that feed into AI-driven incident investigation or alerting workflows, this is a capability that was unavailable even twelve months ago.
Why managed matters
The first thing most teams underestimate about this stack is not the initial setup: it is the ongoing operational surface.
On Kafka, the harder work starts after launch. Partition leader rebalancing when a broker restarts under load. KRaft controller quorum recovery after a node failure. Consumer group offset management when a sink connector falls behind and you need to replay events without duplicating records downstream. JVM heap tuning as throughput grows. Connector worker restart policies that do not lose in-flight events. On OpenSearch, add shard allocation decisions during cluster scaling, index lifecycle management policies to control storage costs as event volumes grow, and JVM tuning for the ML nodes that power vector and neural search. On ClickHouse, merge tree settings and partition pruning strategy matter from day one: getting these wrong early means rewriting table schemas under load.
Managed services absorb this operational surface. Rolling upgrades run without downtime because the service handles leader migration before taking a node offline. Connector workers are monitored and restarted automatically. Failover is handled at the infrastructure level across availability zones. Index lifecycle policies are configurable through the console rather than through manually applied configuration files. Analytics engineers already spend up to 40 per cent of their time on infrastructure maintenance rather than delivering insights. The managed services model moves that complexity to a layer you do not have to own.
For teams in Europe, there is a second dimension. Hyperscaler deployments in EU regions run on infrastructure governed by U.S. law, which means the legal framework around who can access your data, and under what circumstances, is not straightforward. Running on OVHcloud means the infrastructure is European, operational control is European, and the jurisdiction governing data access is unambiguous. For teams in regulated industries, or for any team that fields GDPR compliance questions from customers or auditors, that is a material difference from a cloud region that happens to be located in Europe.
Pricing is the third dimension. Hyperscaler bills can be opaque: data transfer costs between services, storage billed separately from compute, egress fees that compound as event volumes grow. OVHcloud pricing includes IOPS, traffic, and backups. You see the cost before you provision. There are no surprises when your Kafka throughput increases.
Building it on OVHcloud
OVHcloud runs all four layers as managed services, deployed and monitored from a single console.
Provision Managed Kafka, pick your region, and your cluster is ready in minutes. Kafka 4.0 with KRaft means no ZooKeeper to configure or monitor. Add Managed Kafka Connect and configure your PostgreSQL source connector, with optional Debezium CDC for full row-level change capture. Then provision Managed ClickHouse and add a sink connector to start routing events from your Kafka topics into ClickHouse tables, or provision Managed OpenSearch and route events there instead. Add Managed Grafana to connect to both engines and begin building dashboards on live data.
The full stack is five managed services on one platform: PostgreSQL, Kafka, ClickHouse or OpenSearch (or both), and Grafana. One console for provisioning and monitoring. One bill. One support team that understands the full pipeline, not just individual components in isolation.
Start with one layer
You do not have to build the whole pipeline on day one. The most common starting point is Kafka: get your data flowing before you decide where it is going. Once events are moving through Kafka topics, adding ClickHouse or OpenSearch is a connector configuration, not a re-architecture.
The pipeline you build this way is modular by design. Each layer adds independent value. The team that starts with Kafka and adds ClickHouse six months later has not wasted anything in between. The Kafka layer was already doing its job. The pipeline grew without disrupting what was already working.
The infrastructure is managed. The data stays in your hands. The pricing is transparent. The pipeline you need already exists on one stack.
Explore the OVHcloud managed data pipeline

Product Marketing Manager for Databases

Elena Luoto
Creative Copywriter, OVHcloud.
American and French, Elena performs copywriting, editing, storytelling, brand strategy, English teaching, and interview/voiceover work at OVHcloud in Paris.