Metrics

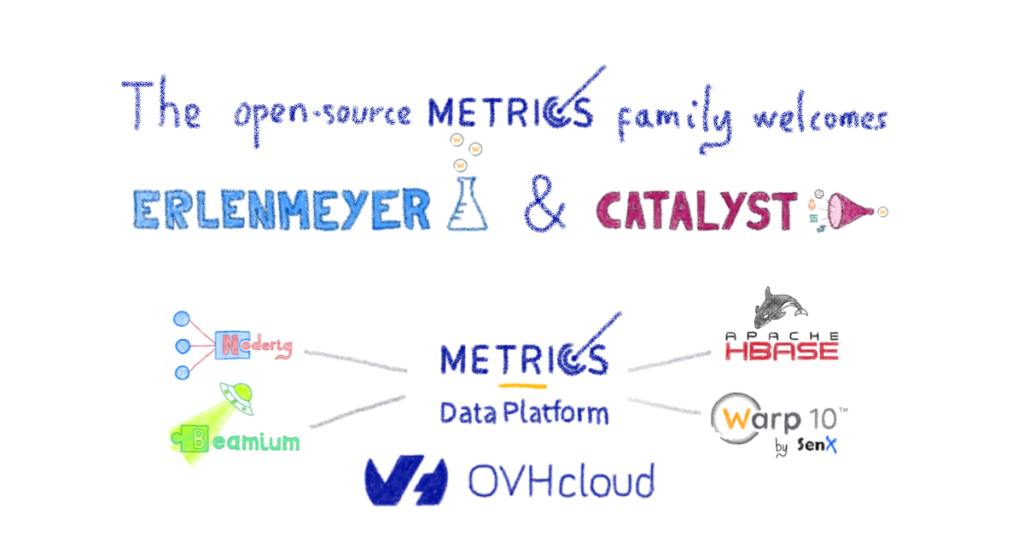
The Open Source Metrics family welcomes Catalyst and Erlenmeyer

At OVHcloud Metrics, we love open source! Our goal is to provide all of our users with a full experience. We rely on the Warp10 time series database which enables us to build open source tools for our users benefit. Let’s take a look at some in this blogpost. Storage tool Our Infrastructure is based

The Open Source Metrics family welcomes Catalyst and Erlenmeyer Read More »

Jerem: an agile bot

Jerem: An Agile Bot

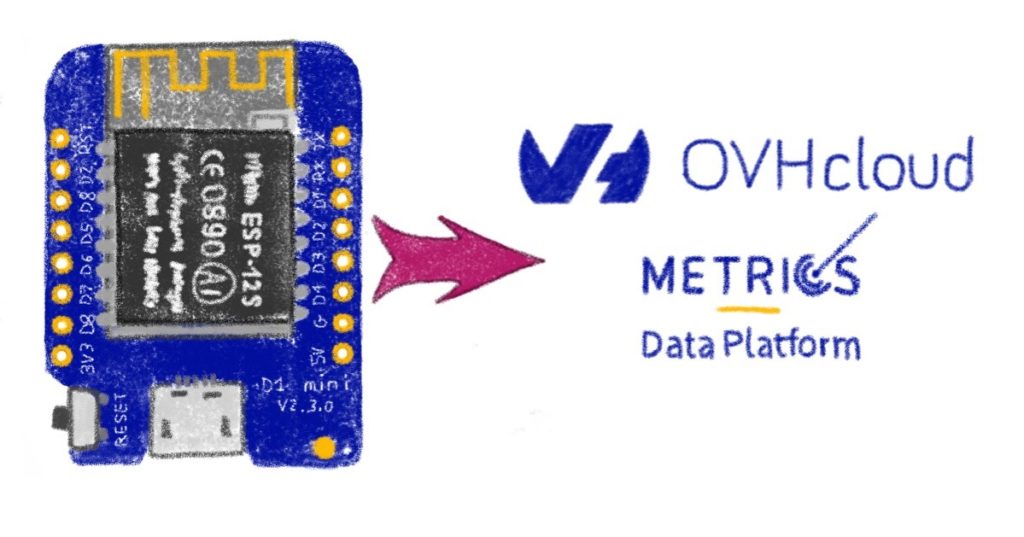
At OVHCloud, we are open sourcing our “Agility Telemetry” project. Jerem, as our data collector, is the main component of this project. Jerem scrapes our JIRA at regular intervals, and extracts specific metrics for each project. It then forwards them to our long-time storage application, the OVHCloud Metrics Data Platform.   Agility concepts from a developer’s

Jerem: An Agile Bot Read More »

Contributing to Apache HBase: custom data balancing

Contributing to Apache HBase: custom data balancing

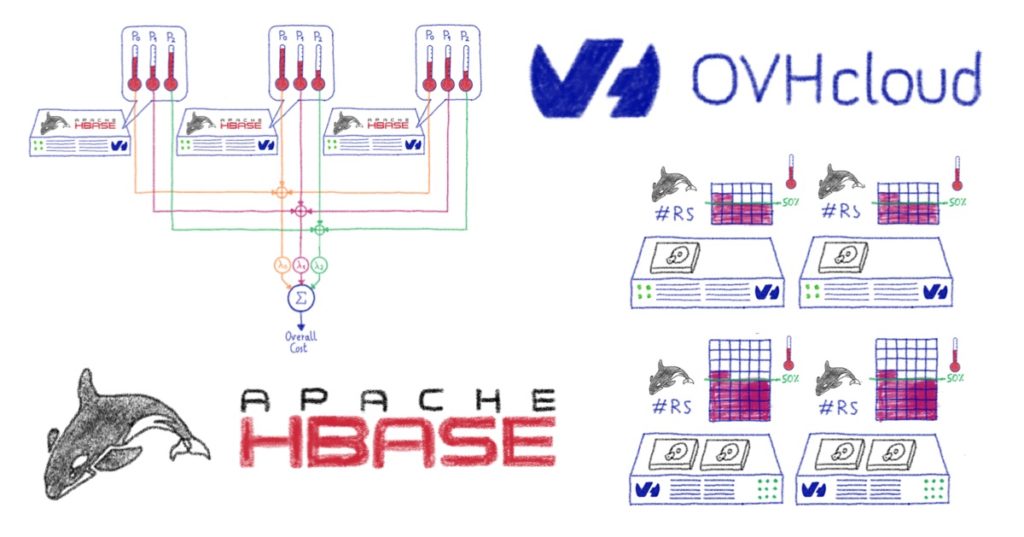
In today’s blogpost, we’re going to take a look at our upstream contribution to Apache HBase’s stochastic load balancer, based on our experience of running HBase clusters to support OVHcloud’s monitoring. The context Have you ever wondered how: we generate the graphs for your OVHcloud server or web hosting package? our internal teams monitor their

Contributing to Apache HBase: custom data balancing Read More »

TSL by OVHcloud

TSL (or how to query time series databases)

Last year, we released TSL as an open source tool to query a Warp 10 platform, and by extension, the OVHcloud Metrics Data Platform. But how has it evolved since then? Is TSL ready to query other time series databases? What about TSL states on the Warp10 eco-system? TSL to query many time series databases

TSL (or how to query time series databases) Read More »

How to monitor your Kubernetes Cluster with OVH Observability

Our colleagues in the K8S team launched the OVH Managed Kubernetes solution last week, in which they manage the Kubernetes master components and spawn your nodes on top of our Public Cloud solution. I will not describe the details of how it works here, but there are already many blog posts about it (here and here, to get you

How to monitor your Kubernetes Cluster with OVH Observability Read More »

Monitoring guidelines for OVH Observability

At the OVH Observability (formerly Metrics) team, we collect, process and analyse most of OVH’s monitoring data. It represents about 500M unique metrics, pushing data points at a steady rate of 5M per second. This data can be classified in two ways: host or application monitoring. Host monitoring is mostly based on hardware counters (CPU,

Monitoring guidelines for OVH Observability Read More »

TSL - Time Series Language

TSL: a developer-friendly Time Series query language for all our metrics

At the Metrics team we have been working on time series for several years. From our experience the data analytics capabilities of a Time Series Database (TSDB) platform is a key factor to create value from your metrics. And these analytics capabilities are mostly defined by the query languages they support. 

TSL stands for Time Series Language. In a few words, TSL is an abstracted way, under the form of an HTTP proxy, to generate queries for different TSDB backends. Currently it supports Warp 10’s WarpScript and  Prometheus’ PromQL query languages but we aim to extend the support to other major TSDB.

To better understand why we created TSL, we are reviewing some of the TSDB query languages supported on OVH Metrics Data Platform. When implementing them, we learnt the good, the bad and the ugly of each one. At the end, we decided to build TSL to simplify the querying on our platform, before open-sourcing it to use it on any TSDB solution. 

Why did we decide to invest some of our Time in such a proxy? Let me tell you the story of the OVH metrics protocol!


TSL: a developer-friendly Time Series query language for all our metrics Read More »

OVH & Apache Flink

Handling OVH’s alerts with Apache Flink

OVH relies extensively on metrics to effectively monitor its entire stack. Whenever they are low-level or business centric, they allow teams to gain insight into how our services are operating on a daily basis. The need to store millions of datapoints per second has produced the need to create a dedicated team to build a operate a product to handle that load: Metrics Data Platform. By relying on Apache Hbase, Apache Kafka and Warp 10, we succeeded in creating a fully distributed platform that is handling all our metrics… and yours!

After building the platform to deal with all those metrics, our next challenge was to build one of the most needed feature for Metrics: Alerting. 

Handling OVH’s alerts with Apache Flink Read More »