If you’re one of our Hosted Private Cloud managed VMware customers, you are probably familiar with the vScope view we’ve been providing for a long time.
Well, this view will be soon replaced by a new dashboard based on VMware Aria Operations (vROps)

This new dashboard includes more information that vScope. It still provides real time information and up to 30days of history. Very useful when you’re back from a well-deserved time off, when you want to identify patterns or just when someone tells you about a problem a week later 😊
A bit of history:
vScope started a long, long time ago (in a galaxy not so far away) and was providing nearly real-time status of your VMware hosts, datastores and VMs. Well, real time give or take 5mn….
At the time, it was convenient and simple enough to give an overview of your PCC and automatic colour coding was a great help to immediately identify potential problems.
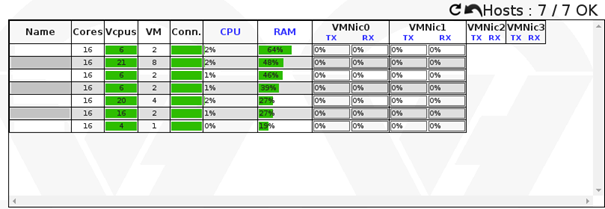
Historical data was already available for Hosts and Virtual machines (up to 30days), so the basics were covered: mostly real time and historical data.
But because we always strive to improve the solution we are providing (even those for free like this one), we weren’t satisfied.
So we released vScope V2.
With HTML5, it was also a great step for a mobile version, providing even more information and in a clearer view for both desktop and mobile users.
And the support for API access was implemented, enabling you to import vScope data in your own monitoring software.
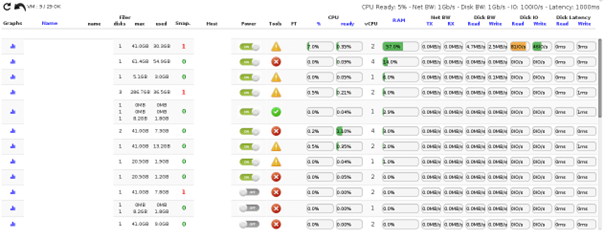
We also renewed vScope for a V3, but the changes were mainly on the infrastructure side to help us grow and maintain it while keeping performance at its best for you.
Hello 2023, hello vROps:
As a VMware user, you are familiar with vRealize Operations Manager (now called VMWare Aria Operations).
This tool from VMware allows you to monitor, detect and anticipate. Which is great, but it can be a bit overwhelming as a lot of its configuration relies on the user.
vRealize Operations Manager has been available since vSphere 6 at OVHcloud and is still available for our customer should they wish to enable, configure and use it.
But sometimes, as humans, we want more without doing a lot more. And that’s exactly where our new version of vScope arrives.
Our new configuration-less monitoring tool for our VMware customers is using VMWare Aria Operations, so in fact, we’re dropping “vScope” altogether and moving to “vROps”.
You get the immediate benefit of a software developed by the editor, made for his own products and deployed and maintained by OVHcloud, and enabled automatically on your VMware infrastructure hosted by OVHcloud.
This OVHcloud dashboard will appear in Dashboards > OVHcloud – Historical Dashboard.
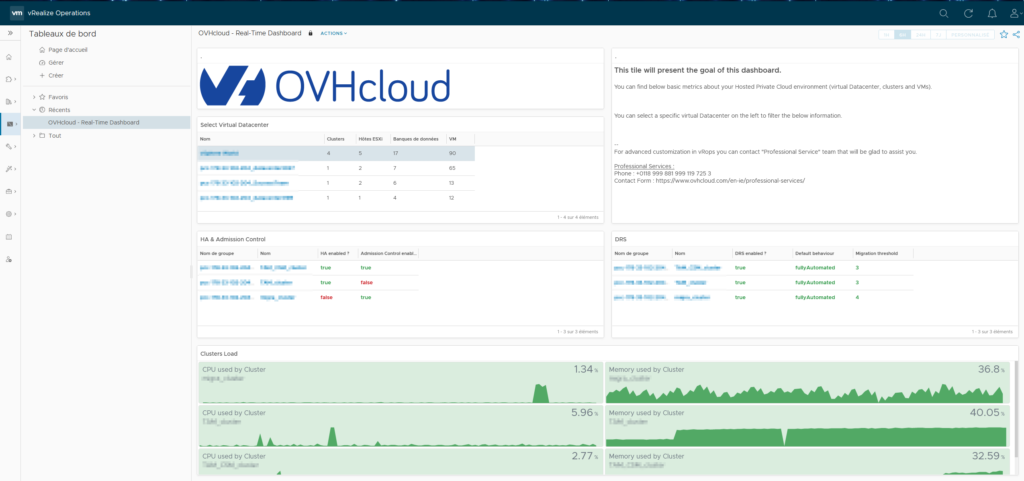
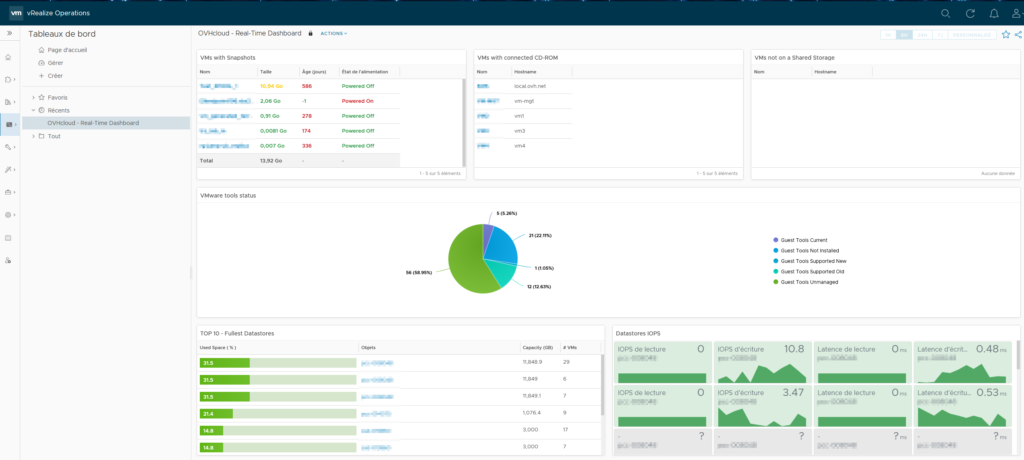
As usual, you can easily monitor and identify patterns in CPU/memory usage, monitor storage usage and more.
You can also easily check which Virtual Machines are overprovisioned in terms of compute resources. And since you’ll be reducing the assigned (or even reserved) resources, you can use the freed cores/memory for even more VM and containers.
Without having to add physical servers to your cluster, so you optimize your usage and your budget.
You get the usual (real) real-time information, the historical data, the mobile friendly version, the API compatibility.
And on top of it: the ability to send emails in case of alerts, the option to personalize the dashboards with our Professional Services experts.
You can also create additional dashboards as you would have done in the past if you were using vROps already. This one will stay available for a quick general overview of your resources.
So we do hope that integrating vScope in vROps will satisfy you and provide you with even more insight and tools to get the best of your VMware on OVHcloud services.
Let us know directly in our Discord channel or through the usual Mailing List.
Technical Marketing Specialist @OVHcloud
About 20 years of experience in HW storage/backup/replication.....

