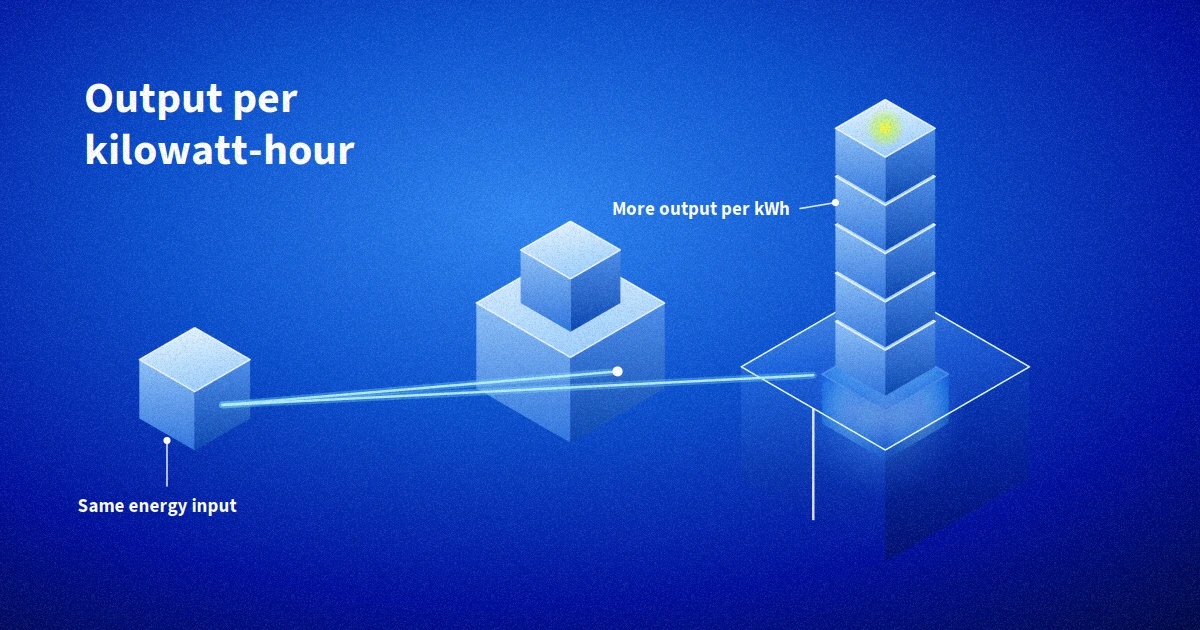
Proper measurement matters: imagine two datacentres that draw exactly the same amount of power. On paper, they may look equally efficient. In practice, one can deliver far more usable computing power than the other, because its processors, accelerators, and cooling systems are better matched together. But the consumption figure tells you none of this.
For a long time, it hardly mattered that consumption figures said so little about actual performance. With the rise of artificial intelligence, this has become a strategic question for sustainable datacentres. If datacentres are going to need many times more energy in the coming years, counting consumption is no longer enough. What matters is what you really get out of every kilowatt-hour you put in.
Therefore, anyone who wants to assess the sustainability of IT infrastructure seriously has to shift their focus from input to output. The key question isn’t “How much energy goes in?” but “How much computing power comes out, and how little is lost along the way?”
AI is changing the efficiency equation
The scale is considerable. According to a study by Allianz Trade, the datacentre industry emitted around 286 million tonnes of CO₂ worldwide in 2025, roughly 57% more than earlier estimates had assumed. The German research institute Öko-Institut considers it possible that global electricity consumption by AI datacentres could increase elevenfold between 2023 and 2030.
At the same time, the pressure is growing to measure the industry’s energy and carbon footprint more precisely, and to anchor it in regulation. For businesses, this means that where and how their workloads run is increasingly also a question of their own sustainability performance.
The problem is that traditional metrics fall short when it comes to assessing sustainable datacentres. Datacentre efficiency has typically been described in terms of total energy consumption and capacity figures such as connected load in megawatts. These figures say a lot about how big a site is, but little about how productively it works. It’s a bit like judging a car’s efficiency by the size of its fuel tank.
New metrics: what each joule produces
This means the industry is shifting its perspective: away from pure consumption figures and towards measures that capture the real value delivered per unit of energy.
In high-performance computing, this approach has long been established. The key metric there is FLOPS per watt, which describes how many floating-point operations a system delivers per second for every watt of power it draws. By this measure, two clusters with identical power consumption can perform very differently.
For AI workloads, there are comparable but more specific metrics:
- Samples per joule for model training, meaning how many data samples are processed per unit of energy
- Tokens per joule for large language model inference, meaning how much output a model generates per unit of energy
These metrics lead to a conclusion that seems counterintuitive at first: a system that draws more power overall can be more efficient than its predecessor. If a new hardware generation delivers significantly more tokens per joule, it’s the more sustainable choice, even if its absolute power draw is higher.
So efficiency doesn’t necessarily come from consuming less. Above all, it comes from getting more out of the same or a moderately higher energy input. And this is where infrastructure comes in.
Infrastructure as a lever: rethinking cooling
Output-based metrics measure how efficiently the IT itself works. Just as important is how much energy and water is lost around the IT (for cooling, power conversion, or lighting). The two levels belong together: a datacentre is only truly efficient when the servers perform well and as little energy as possible is lost outside the IT.
Cooling accounts for the largest share of this overhead. The overhead as a whole can be measured with Power Usage Effectiveness (PUE), which sets a datacentre’s total energy demand against the energy demand of its IT. A value close to 1.0 is considered optimal, because it means almost no energy is used outside the servers.
OVHcloud relies on water cooling, because water can absorb far more heat than air. OVHcloud’s in-house technology works with a closed loop. Direct-to-chip water blocks sit directly on the CPU and GPU, capture heat right at the source, and carry it through the entire datacentre to dry coolers.
How the results compare:
| Metric | OVHcloud | Industry benchmark |
|---|---|---|
| PUE | Around 1.24 group average, 1.19 at both the Limburg (Germany) and Erith (UK) sites (FY2025) | Around 1.46 (average for German datacentres, 2024) |
| WUE (litres per kWh) | 0.34 group average, 0.21 at the Limburg site and 0.18 at the Erith site (FY2025) | Around 1.8 (US average) |
Sources: OVHcloud, key figures for fiscal year 2025; Germany: Bitkom/Borderstep Institute, “Rechenzentren in Deutschland: Aktuelle Marktentwicklungen” (2025); US: Lawrence Berkeley National Laboratory, “United States Data Center Energy Usage Report” (2016).
The difference is most striking when it comes to water. Water Usage Effectiveness (WUE) describes how much water is needed for cooling per kilowatt-hour. While an average US datacentre needs around 1.8 litres per kilowatt-hour (a good seven glasses of water), OVHcloud’s sites in Limburg, Germany, and Erith, UK, each need less than one glass.
Find out more about how OVHcloud puts sustainability into practice on our sustainability page.
From cooled to self-optimising datacentres
Efficient hardware is only one side of the equation; the other is intelligent operation. The next step is therefore the Smart Datacenter, a datacentre that regulates its own cooling while planning ahead.
This works in three stages:
- Measure: Sensors on the cooling modules capture parameters such as flow rate and water temperature in real time.
- Control: AI-based control analyses the data and adjusts pump speed, fan speed, and valve positions so that the servers get exactly the flow and pressure they need, while using as little water as possible.
- Predict: Operating data from racks, cooling modules, and dry coolers flows into a data lake and is combined with local weather data. This makes it possible to forecast how much cooling water will be needed.
OVHcloud has also developed its technology outside the building. Compared with the previous generation, the new Smart Dry Cooler needs around half the footprint and half as many fans. This noticeably reduces both the power used for cooling and noise levels.
Altogether, the new architecture cuts the power consumption of the cooling infrastructure by up to 50% and the water used for cooling by up to 30% compared with OVHcloud’s original design. Our behind-the-scenes look shows in detail how racks, cooling modules, and Smart Dry Coolers work together.
What this means for IT decision-makers
This shift in perspective doesn’t just affect how datacentres are run. It also changes how businesses should evaluate infrastructure and cloud services. If you’re relying on sustainable datacentres while planning for growing AI workloads, you can ask targeted questions when choosing a provider:
- What are the PUE and WUE, and what do they refer to? Ask for both the average across all sites and the figures for the newest facilities. Only together do they show where a provider stands today and where it’s heading.
- How is cooling done? Air, water, or direct-to-chip: the cooling technology largely determines how much energy and water is used outside the servers.
- How is cooling controlled? Static systems often run with a safety margin. Sensor-based, predictive control adapts to current demand.
- Which hardware suits your workload? For training and inference, it’s worth looking at samples or tokens per joule rather than raw power draw.
- What data do you get for your own reporting? As regulatory requirements increase, transparency about resource consumption is becoming a selection criterion.
Behind all this is a simple change in the guiding question. Instead of “How much does this datacentre consume?”, it becomes “How much computing power do I get per kilowatt-hour and per litre of water?” Asking it this way leads to infrastructure decisions that make sense both environmentally and economically. More computing power per kilowatt-hour usually means more performance for your money, and your provider’s efficiency feeds directly into your own sustainability reporting through Scope 3 emissions.
Conclusion: efficiency is measured by results
Consumption figures remain a useful guide. But in the AI era, they’re no longer enough for assessing sustainable datacentres. You only get the full picture when two perspectives come together: how much usable computing power is produced per unit of energy, and how little energy and water is lost around the IT.
Water cooling, direct-to-chip technology, and AI-based control show that the two can be combined. The Smart Datacenter saves resources exactly where they matter most for actual computing output. So when you compare providers, don’t just ask about consumption. Ask about computing power per kilowatt-hour and per litre of water. You can see what OVHcloud offers for AI projects on our AI & Machine Learning page.