
GHG Protocol, CUE, Scope 1, 2, 3... Trying to understand the carbon'impact'devaluation system of your cloud services? Again, it’s the puzzle! Still, have you made sure you'have found the best metrics to meet'CIO 2030 sustainability criteria and run your business sustainably? The only catch is that there is a deluge of indicators flourishing everywhere. But here's a sure way to find'him easily.
They appear in various public and non-public studies. Worse, there is rarely mention of certifications, methodologies, and organizations that could robustly support you in your quest for sustainability.
Because'they are not unified, methodologies are often unreliable, non-transparent, or even biased.
But don't look anymore. We’ve gone through this tedious process, and we’ve introduced you to proven metrics to help you benchmark cloud industry players.
Below is a list of them. Our combined expertise with European standards is the assurance that we have taken the necessary precautions to verify their sincerity and identify any potential bias in their interpretation.
Global indicators that meet the most demanding protocols:
- Carbon footprint in the sense of the GHG protocol
This is standardized compatibility (comparable to IFRS in financial terms).
Its merit is to list very clearly the emission positions that must be taken into account and to organize them by categories (scopes) to allow a better reading of the levers that are directly in the hands of the company.
The biases most often observed are the absence of Scope 3 (indirect upstream and downstream emissions) or its incomplete nature. This is a significant part of the cloud impact, however, and server manufacturing dominates.
For example, in 2023, OVHcloud Scope 3 accounted for 54.5% of our global emissions.
On Scope 2 (indirect emissions), which corresponds to the emissions related to the production of electricity used by the company, far too many players delay the issue by using market-based emission factors and fail to do so with location-based emission factors.
The physical reality is that unless the site is self-generating/consuming 24/7, the nature of the electricity that powers the datacentre is that of the energy mix of the territory in which it is generated.
So only location-based factors are relevant. Using market-based factors in addition is only interesting to demonstrate the effect of the renewable energy purchasing policy that the company has implemented via CPPAs (Corporate Power Purchase Agreements) or other Renewable Energy Certificates.
For example, in 2023, OVHcloud Scope 2 accounted for 44.7% of our global emissions and the share of renewable energy in our energy mix was 91%.
This can be seen through simple questions such as:
- Do you transfer your Scope 3?
- On what basis do you take into account the carbon weight of IT equipment?
- What emission factors do you use for Scope 2?
- Do you include air conditioning, heating of the tertiary premises?
- Travel, travel, equipment supply for employees?
- CUE (Carbon Usage Effectiveness) as defined in ISO/IEC 30134-8:2022
The cloud industry is reluctant to publish it, but it does put Scopes 1 and 2 in perspective of the size of the business, and so compares the players.
In 2023, OVHcloud’s CUE was 0.18 kgCO2/kWh (location based).
The advantage of this indicator is that, for a given energy mix, it makes it possible to compare the performance of two Cloud Services Providers on the energy efficiency of their infrastructure, since the lower the PUE (Power Usage Effectiveness), the more Scope 2 will be (with an equivalent IT charge).
- Overall emissions (Scopes 1, 2 and 3) on the workforce
These indicators can be derived fairly easily from information contained in companies’ extra-financial performance statements (when submitted) or through information published in databases such as the Carbon Disclosure Project (CDP). It is to be taken with great caution, as everything depends on where the player in the value chain is located, as well as the completeness of their carbon accounting.
For example, component manufacturers will typically be between 50 and 100 TCO2e per employee per year, whereas cloud operators will be between 25 and 50 TCO2e per employee per year.
For your information, in 2023, OVHcloud’s global emissions were 131 kTCO2e for 2,900 employees, or 45 TCO2e per employee per year across the entire cloud value chain: from server manufacturing to IaaS/PaaS/SaaS services.
Service-wide metrics
By their nature, they derive from the overall indicators. They will only be relevant if the company’s overall carbon footprint is comprehensive and accurate.
- The carbon footprint of a given cloud service (IaaS, PaaS or SaaS)
Many carbon “calculators” are beginning to appear on the market, but it must be noted that the methodologies differ greatly. What matters most is the ability of the computers to precisely allocate the Scope 2 and Scope 3 emissions which are the most important shares.
OVHcloud launched its calculator in 2023 for all of its Private Cloud services (Bare Metal, Hosted Private Cloud).
To date, here are some comparisons to understand its benefits:
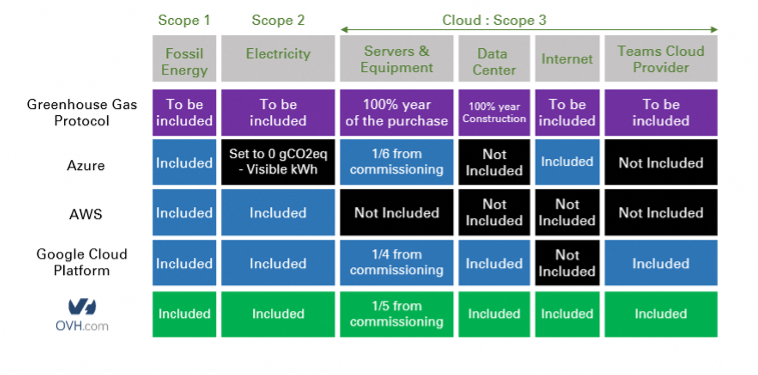
In 2024, we plan to extend this tool to the Public Cloud for full coverage of our range of cloud services. The comparison with the players can then be made on all segments.
As with the overall indicators, it is possible to see more clearly through simple questions such as:
- What are the emissions related to the manufacturing phase of IT infrastructure? Do you also reallocate a portion of the internal IT infrastructure required to deliver my services?
- What are the emissions related to the usage phase (electricity)? What factors do you take (market vs location based)? Do you take into account measured or theoretical power consumption? If you don't measure it, which model do you use: maximum consumption, average consumption, etc. ?
- Do you also reallocate all other of your company’s emissions that are essential for the operations of the services I subscribe to (network, buildings, freight, travel, waste, etc.)?
- The carbon footprint of a given cloud service (IaaS, PaaS or SaaS) reduced to its price
This flag should not be used. Regardless of the fact that it is first necessary to ensure that the numerator of the ratio (absolute emissions) covers all emission items, this indicator induces an undeniable bias: it places the least expensive actors with comparable emissions at a disadvantage.
Worse, for an equivalent service, a 20% less emitting and 30% cheaper player will have a lower “good rating”!
- The carbon footprint of a given cloud service per physical or functional unit
This is definitely a good approach. By thinking by business unit, any type of cloud service can be rebuilt and its impact accurately calculated.
The redesign of the PCR (Product Category Rule) is in progress. OVHcloud is proud to have answered ADEME’s call to participate. The results are expected at the end of the year and we will act as an echo chamber.
A temperature, a mass, a volume are indicators that are easy to compare because they are standardized. A financial statement also because it is standardized and audited before publication.
The same logic should guide the publication of environmental indicators.
If the “producer” does not, the “consumer” can.
Find out more about our environmental commitments