
Take your LLM (Large Language Model) deployment to production level with comprehensive custom autoscaling configuration and advanced vLLM metrics observability.
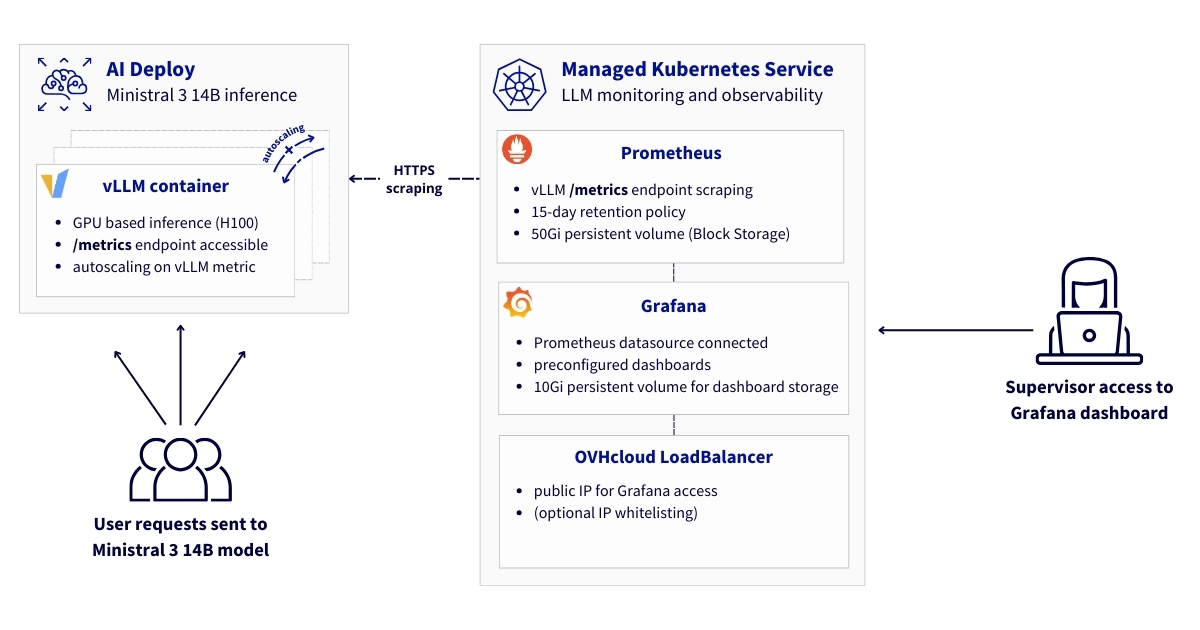
This reference architecture describes a comprehensive solution for deploying, autoscaling and monitoring vLLM-based LLM workloads on OVHcloud infrastructure. It combinesAI Deploy, used for model serving with custom metric autoscaling, and Managed Kubernetes Service (MKS), which hosts the monitoring and observability stack.
By leveraging application-level Prometheus metrics exposed by vLLM, AI Deploy can automatically scale inference replicas based on real workload demand, ensuring high availability, consistent performance under load and efficient GPU utilisation. This autoscaling mechanism allows the platform to react dynamically to traffic spikes while maintaining predictable latency for end users.
On top of this scalable inference layer, the monitoring architecture provides observability through Prometheus, Grafana and Alertmanager. It enables real-time performance monitoring, capacity planning, and operational insights, while ensuring full data sovereignty for organisations running Large Language Models (LLMs) in production environments.
What are the key benefits?
- Cost-effective: Leverage managed services to minimise operational overhead
- Real-time observability: Track Time-to-First-Token (TTFT), throughput, and resource utilisation
- Sovereign infrastructure: All metrics and data remain within European datacentres
- Production-ready: Persistent storage, high availability, and automated monitoring
Context
AI Deploy
OVHcloud AI Deploy is a Container as a Service (CaaS) platform designed to help you deploy, manage and scale AI models. It provides a solution that allows you to optimally deploy your applications/APIs based on Machine Learning (ML), Deep Learning (DL) or Large Language Models (LLMs).
Key points to keep in mind:
- Easy to use: Bring your own custom Docker image and deploy it in a command line or a few clicks surely
- High-performance computing: A complete range of GPUs available (H100, A100, V100S, L40S and L4)
- Scalability and flexibility: Supports automatic scaling, allowing your model to effectively handle fluctuating workloads
- Cost-efficient: Billing per minute, no surcharges
Managed Kubernetes Service
OVHcloud MKS is a fully managed Kubernetes platform designed to help you deploy, operate, and scale containerised applications in production. It provides a secure and reliable Kubernetes environment without the operational overhead of managing the control plane.
What should you keep in mind?
- Cost-efficient: Only pay for worker nodes and consumed resources, with no additional charge for the Kubernetes control plane
- Fully managed Kubernetes: Certified upstream Kubernetes with automated control plane management, upgrades and high availability
- Production-ready by design: Built-in integrations with OVHcloud Load Balancers, networking and persistent storage
- Scalability and flexibility: Easily scale workloads and node pools to match application demand
- Open and portable: Based on standard Kubernetes APIs, enabling seamless integration with open-source ecosystems and avoiding vendor lock-in
In the following guide, all services are deployed within the OVHcloud Public Cloud.
Overview of the architecture
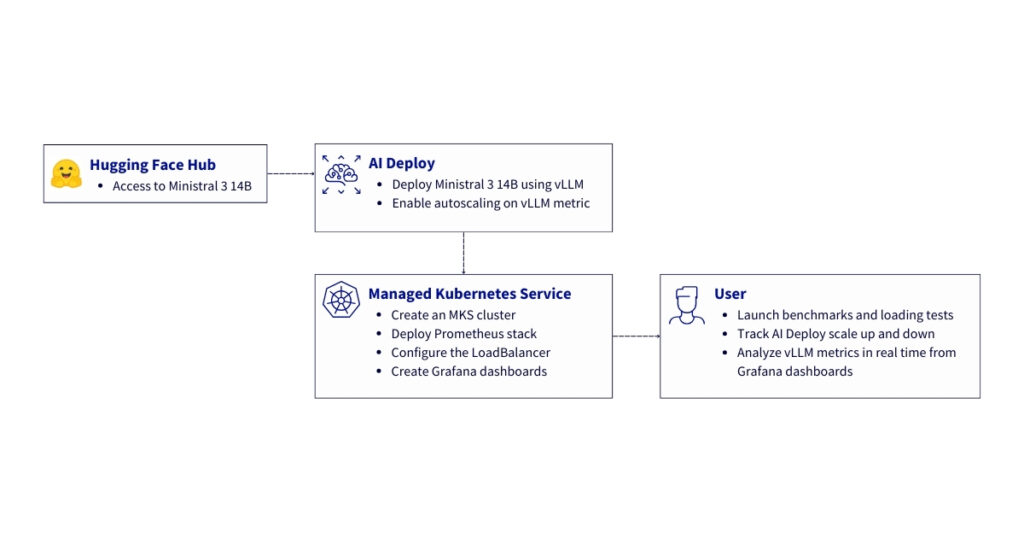
This reference architecture describes a complete, secure and scalable solution to:
- Deploy an LLM with vLLM and AI Deploy, benefiting from automatic scaling based on custom metrics to ensure high service availability – vLLM exposes
/metricsvia its public HTTPS endpoint on AI Deploy - Collect, store and visualise these vLLM metrics using Prometheus and Grafana on MKS
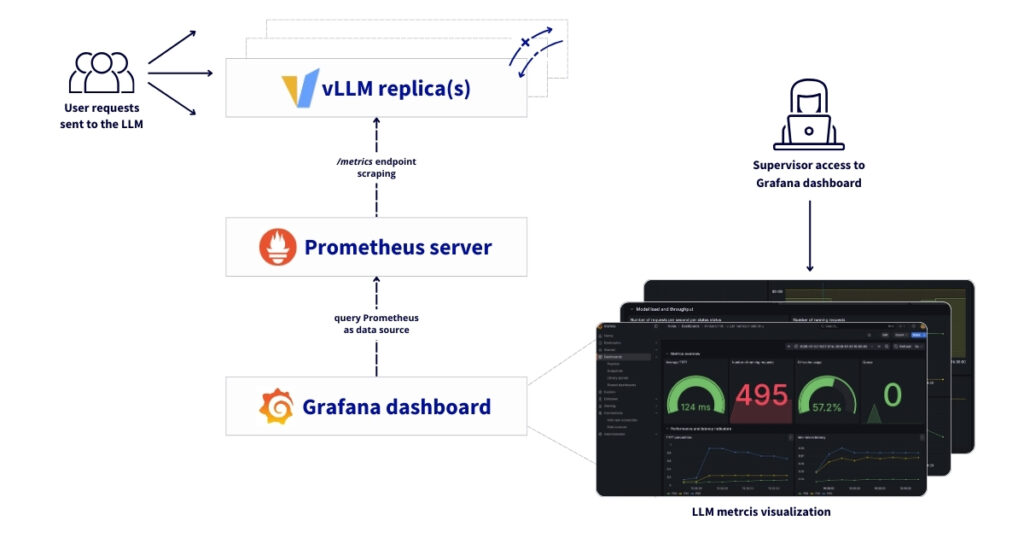
Here you will find the main components of the architecture. The solution comprises three main layers:
- Model serving layer with AI Deploy
- vLLM containers running on top of GPUs for LLM inference
- vLLM inference server exposing Prometheus metrics
- Automatic scaling based on custom metrics to ensure high availability
- HTTPS endpoints with Bearer token authentication
- Monitoring and observability infrastructure using Kubernetes
- Prometheus for metrics collection and storage
- Grafana for visualisation and dashboards
- Persistent volume storage for long-term retention
- Network layer
- Secure HTTPS communication between components
- OVHcloud LoadBalancer for external access
To go further, some prerequisites must be checked!
Prerequisites
Before you begin, ensure you have:
- An OVHcloud Public Cloud account
- An OpenStack user with the
Administratorrole - ovhai CLI available – install the ovhai CLI
- A Hugging Face access – create a Hugging Face account and generate an access token
kubectlinstalled andhelminstalled (at least version 3.x)
🚀 Now you have all the ingredients for our recipe, it’s time to deploy the Ministral 14B using AI Deploy and vLLM Docker container!
Architecture guide: From autoscaling to observability for LLMs served by vLLM
Let’s set up and deploy this architecture!
✅ Note
In this example, mistralai/Ministral-3-14B-Instruct-2512 is used. Choose the open-source model of your choice and follow the same steps, adapting the model slug (from Hugging Face), the versions and the GPU(s) flavour.
Remember that all of the following steps can be automated using OVHcloud APIs!
Step 1 – Manage access tokens
Before introducing the monitoring stack, this architecture starts with the deployment of the Ministral 3 14B on OVHcloud AI Deploy, configured to autoscale based on custom Prometheus metrics exposed by vLLM itself.
Export your Hugging Face token.
export MY_HF_TOKEN=hf_xxxxxxxxxxxxxxxxxxxxCreate a Bearer token to access your AI Deploy app once it’s been deployed.
ovhai token create --role operator ai_deploy_token=my_operator_tokenReturning the following output:
Id: 47292486-fb98-4a5b-8451-600895597a2b
Created At: 20-01-26 11:53:05
Updated At: 20-01-26 11:53:05
Spec:
Name: ai_deploy_token=my_operator_token
Role: AiTrainingOperator
Label Selector:
Status:
Value: XXXXXXXXXXXXXXXXXXXXXXXXXXXXXX
Version: 1
You can now store and export your access token:
export MY_OVHAI_ACCESS_TOKEN=XXXXXXXXXXXXXXXXXXXXXXXXXXXXXXStep 2 – LLM deployment using AI Deploy
Before introducing the monitoring stack, this architecture starts with the deployment of the Ministral 3 14B on OVHcloud AI Deploy, configured to autoscale based on custom Prometheus metrics exposed by vLLM itself.
1. Define the targeted vLLM metric for autoscaling
Before proceeding with the deployment of the Ministral 3 14B endpoint, you have to choose the metric you want to use as the trigger for scaling.
Instead of relying solely on CPU/RAM utilisation, AI Deploy allows autoscaling decisions to be driven by application-level signals.
To do this, you can consult the metrics exposed by vLLM.
In this example, you can use a basic metric such as vllm:num_requests_running to scale the number of replicas based on real inference load.
This enables:
- Faster reaction to traffic spikes
- Better GPU utilisation
- Reduced inference latency under load
- Cost-efficient scaling
Finally, the configuration chosen for scaling this application is as follows:
| Parameter | Value | Description |
|---|---|---|
| Metric source | /metrics | vLLM Prometheus endpoint |
| Metric name | vllm:num_requests_running | Number of in-flight requests |
| Aggregation | AVERAGE | Mean across replicas |
| Target value | 50 | Desired load per replica |
| Min replicas | 1 | Baseline capacity |
| Max replicas | 3 | Burst capacity |
✅ Note
You can choose the metric that best suits your use case. You can also apply a patch to your AI Deploy deployment at any time to change the target metric for scaling.
When the average number of running requests exceeds 50, AI Deploy automatically provisions additional GPU-backed replicas.
2. Deploy Ministral 3 14B using AI Deploy
Now you can deploy the LLM using the ovhai CLI.
Key elements necessary for proper functioning:
- GPU-based inference:
1 x H100 - vLLM OpenAI-compatible Docker image:
vllm/vllm-openai:v0.13.0 - Custom autoscaling rules based on Prometheus metrics:
vllm:num_requests_running
Below is the reference command used to deploy the mistralai/Ministral-3-14B-Instruct-2512:
ovhai app run \
  --name vllm-ministral-14B-autoscaling-custom-metric \
  --default-http-port 8000 \
  --label ai_deploy_token=my_operator_token \
  --gpu 1 \
  --flavor h100-1-gpu \
  -e OUTLINES_CACHE_DIR=/tmp/.outlines \
  -e HF_TOKEN=$MY_HF_TOKEN \
  -e HF_HOME=/hub \
  -e HF_DATASETS_TRUST_REMOTE_CODE=1 \
  -e HF_HUB_ENABLE_HF_TRANSFER=0 \
  -v standalone:/hub:rw \
  -v standalone:/workspace:rw \
  --liveness-probe-path /health \
  --liveness-probe-port 8000 \
  --liveness-initial-delay-seconds 300 \
  --probe-path /v1/models \
  --probe-port 8000 \
  --initial-delay-seconds 300 \
  --auto-min-replicas 1 \
  --auto-max-replicas 3 \
  --auto-custom-api-url "http://<SELF>:8000/metrics" \
  --auto-custom-metric-format PROMETHEUS \
  --auto-custom-value-location vllm:num_requests_running \
  --auto-custom-target-value 50 \
  --auto-custom-metric-aggregation-type AVERAGE \
  vllm/vllm-openai:v0.13.0 \
  -- bash -c "python3 -m vllm.entrypoints.openai.api_server \
    --model mistralai/Ministral-3-14B-Instruct-2512 \
    --tokenizer_mode mistral \
    --load_format mistral \
    --config_format mistral \
    --enable-auto-tool-choice \
    --tool-call-parser mistral \
    --enable-prefix-caching"
How to understand the different parameters of this command?
a. Start your AI Deploy app
Launch a new app using ovhai CLI and name it.
ovhai app run --name vllm-ministral-14B-autoscaling-custom-metric
b. Define access
Define the HTTP API port and restrict access to your token.
--default-http-port 8000--label ai_deploy_token=my_operator_token
c. Configure GPU resources
Specify the hardware type (h100-1-gpu), which refers to an NVIDIA H100 GPU and the number (1).
--gpu 1
--flavor h100-1-gpu
⚠️WARNING! For this model, one H100 is sufficient, but if you want to deploy another model, you will need to check which GPU you need. Note that you can also access L40S and A100 GPUs for your LLM deployment.
d. Set up environment variables
Configure caching for the Outlines library (used for efficient text generation):
-e OUTLINES_CACHE_DIR=/tmp/.outlines
Pass the Hugging Face token ($MY_HF_TOKEN) for model authentication and download:
-e HF_TOKEN=$MY_HF_TOKEN
Set the Hugging Face cache directory to /hub (where models will be stored):
-e HF_HOME=/hub
Allow execution of custom remote code from Hugging Face datasets (required for some model behaviours):
-e HF_DATASETS_TRUST_REMOTE_CODE=1
Disable Hugging Face Hub transfer acceleration (to use standard model downloading):
-e HF_HUB_ENABLE_HF_TRANSFER=0
e. Mount persistent volumes
Mount two persistent storage volumes:
/hub→ Stores Hugging Face model files/workspace→ Main working directory
The rw flag means read-write access.
-v standalone:/hub:rw
-v standalone:/workspace:rw
f. Health checks and readiness
Configure liveness and readiness probes:
/healthverifies the container is alive/v1/modelsconfirms the model is loaded and ready to serve requests
The long initial delays (300 seconds) can be reduced; they correspond to the startup time of vLLM and the loading of the model on the GPU.
--liveness-probe-path /health
--liveness-probe-port 8000
--liveness-initial-delay-seconds 300

--probe-path /v1/models
--probe-port 8000
--initial-delay-seconds 300
g. Autoscaling configuration (custom metrics)
First set the minimum and maximum number of replicas.
--auto-min-replicas 1
--auto-max-replicas 3
This guarantees basic availability (one replica always up) while allowing for peak capacity.
Then enable autoscaling based on application-level metrics exposed by vLLM.
--auto-custom-api-url "http://<SELF>:8000/metrics"
--auto-custom-metric-format PROMETHEUS
--auto-custom-value-location vllm:num_requests_running
--auto-custom-target-value 50
--auto-custom-metric-aggregation-type AVERAGE
AI Deploy:
- Scrapes the local
/metricsendpoint - Parses Prometheus-formatted metrics
- Extracts the
vllm:num_requests_runninggauge - Computes the average value across replicas
Scaling behaviour:
- When the average number of in-flight requests exceeds
50, AI Deploy adds replicas - When load decreases, replicas are scaled down
This approach ensures high availability and predictable latency under fluctuating traffic.
h. Choose the target Docker image and the startup command
Use the official vLLM OpenAI-compatible Docker image.
vllm/vllm-openai:v0.13.0
Finally, run the model inside the container using a Python command to launch the vLLM API server:
python3 -m vllm.entrypoints.openai.api_server→ Starts the OpenAI-compatible vLLM API server--model mistralai/Ministral-3-14B-Instruct-2512→ Loads the Ministral 3 14B model from Hugging Face--tokenizer_mode mistral→ Uses the Mistral tokenizer--load_format mistral→ Uses Mistral’s model loading format--config_format mistral→ Ensures the model configuration follows Mistral’s standard--enable-auto-tool-choice→ Automatic call of tools if necessary (function/tool call)--tool-call-parser mistral→ Tool calling support--enable-prefix-caching→ Prefix caching for improved throughput and reduced latency
You can now launch this command using ovhai CLI.
3. Check AI Deploy app status
You can now check if your AI Deploy app is alive:
ovhai app get <your_vllm_app_id>Is your app in RUNNING status? Perfect! You can check in the logs that the server is started:
ovhai app logs <your_vllm_app_id>⚠️WARNING! This step may take a little time as the LLM must be loaded.
4. Test that the deployment is functional
First you can request and send a prompt to the LLM. Launch the following query by asking the question of your choice:
curl https://<your_vllm_app_id>.app.gra.ai.cloud.ovh.net/v1/chat/completions \
  -H "Authorization: Bearer $MY_OVHAI_ACCESS_TOKEN" \
  -H "Content-Type: application/json" \
  -d '{
    "model": "mistralai/Ministral-3-14B-Instruct-2512",
    "messages": [
      {"role": "system", "content": "You are a helpful assistant."},
      {"role": "user", "content": "Give me the name of OVHcloud’s founder."}
    ],
    "stream": false
  }'
You can also verify access to vLLM metrics.
curl -H "Authorization: Bearer $MY_OVHAI_ACCESS_TOKEN" \
  https://<your_vllm_app_id>.app.gra.ai.cloud.ovh.net/metrics
If both tests show that the model deployment is functional and you receive 200 HTTP responses, you are ready to move on to the next step!
The next step is to set up the observability and monitoring stack. This autoscaling mechanism is fully independent from Prometheus used for observability:
- AI Deploy queries the local
/metricsendpoint internally - Prometheus scrapes the same metrics endpoint externally for monitoring, dashboards and potentially alerting
This ensures:
- A single source of truth for metrics
- No duplication of exporters
- Consistent signals for scaling and observability
Step 3 – Create an MKS cluster
From OVHcloud Control Panel, create a Kubernetes cluster using the MKS.
Consider using the following configuration for the current use case:
- Location: GRA ( Gravelines) – you can select the same region as for AI Deploy
- Network: Public
- Node pool :
- Flavour :
b2-15(or something similar) - Number of nodes:
3 - Autoscaling :
OFF
- Flavour :
- Name your node pool:
monitoring
You should see your cluster (e.g. prometheus-vllm-metrics-ai-deploy) in the list, along with the following information:
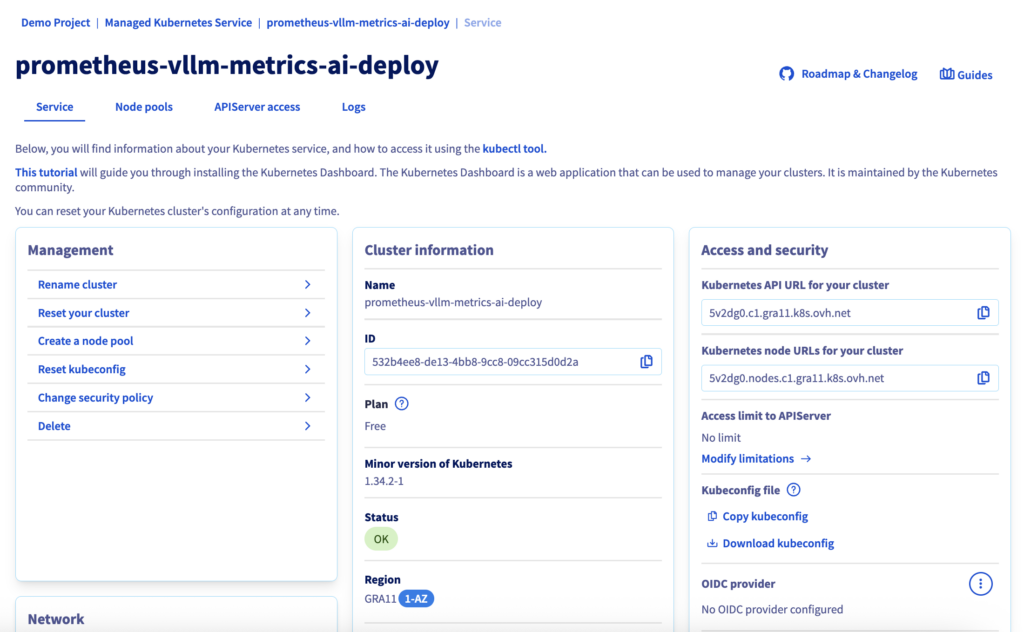
If the status is green with the OK label, you can proceed to the next step.
Step 4 – Configure Kubernetes access
Download your kubeconfig file from the OVHcloud Control Panel and configure kubectl:
# configure kubectl with your MKS cluster
export KUBECONFIG=/path/to/your/kubeconfig-xxxxxx.yml

# verify cluster connectivity
kubectl cluster-info
kubectl get nodes
Now,- you can create the values-prometheus.yaml file:
# general configuration
nameOverride: "monitoring"
fullnameOverride: "monitoring"

# Prometheus configuration
prometheus:
  prometheusSpec:
    # data retention (15d)
    retention: 15d

    # scrape interval (15s)
    scrapeInterval: 15s

    # persistent storage (required for production deployment)
    storageSpec:
      volumeClaimTemplate:
        spec:
          storageClassName: csi-cinder-high-speed  # OVHcloud storage
          accessModes: ["ReadWriteOnce"]
          resources:
            requests:
              storage: 50Gi  # (can be modified according to your needs)

    # scrape vLLM metrics from your AI Deploy instance (Ministral 3 14B)
    additionalScrapeConfigs:
      - job_name: 'vllm-ministral'
        scheme: https
        metrics_path: '/metrics'
        scrape_interval: 15s
        scrape_timeout: 10s

        # authentication using AI Deploy Bearer token stored Kubernetes Secret
        bearer_token_file: /etc/prometheus/secrets/vllm-auth-token/token
        static_configs:
          - targets:
              - '<APP_ID>.app.gra.ai.cloud.ovh.net'  # /!\ REPLACE THE <APP_ID> by yours /!\
            labels:
              service: 'vllm'
              model: 'ministral'
              environment: 'production'

        # TLS configuration
        tls_config:
          insecure_skip_verify: false

    # kube-prometheus-stack mounts the secret under /etc/prometheus/secrets/ and makes it accessible to Prometheus
    secrets:
      - vllm-auth-token

# Grafana configuration (visualization layer)
grafana:
  enabled: true

  # disable automatic datasource provisioning
  sidecar:
    datasources:
      enabled: false

  # persistent dashboards
  persistence:
    enabled: true
    storageClassName: csi-cinder-high-speed
    size: 10Gi

  # /!\ DEFINE ADMIN PASSWORD - REPLACE "test" BY YOURS /!\
  adminPassword: "test"

  # access via OVHcloud LoadBalancer (public IP and managed LB)
  service:
    type: LoadBalancer
    port: 80
    annotations:
      # optional : limiter l'accès à certaines IPs
      # service.beta.kubernetes.io/ovh-loadbalancer-allowed-sources: "1.2.3.4/32"

# alertmanager (optional but recommended for production)
alertmanager:
  enabled: true

  alertmanagerSpec:
    storage:
      volumeClaimTemplate:
        spec:
          storageClassName: csi-cinder-high-speed
          accessModes: ["ReadWriteOnce"]
          resources:
            requests:
              storage: 10Gi

# cluster observability components
nodeExporter:
  enabled: true

kubeStateMetrics:
  enabled: true
✅ Note
On OVHcloud MKS, persistent storage is handled automatically through the Cinder CSI driver. When a PersistentVolumeClaim (PVC) references a supported
storageClassNamesuch ascsi-cinder-high-speed, OVHcloud dynamically provisions the underlying Block Storage volume and attaches it to the node running the pod. This enables stateful components like Prometheus, Alertmanager and Grafana to persist data reliably without any manual volume management, making the architecture fully cloud-native and operationally simple.
Then create the monitoring namespace:
# create namespace
kubectl create namespace monitoring

# verify creation
kubectl get namespaces | grep monitoring
Finally, configure the Bearer token secret to access vLLM metrics.
# create bearer token secret
kubectl create secret generic vllm-auth-token \
  --from-literal=token='"$MY_OVHAI_ACCESS_TOKEN"' \
  -n monitoring

# verify secret creation
kubectl get secret vllm-auth-token -n monitoring

# test token (optional)
kubectl get secret vllm-auth-token -n monitoring \
  -o jsonpath='{.data.token}' | base64 -d
Right, if everything is working, let’s move on to deployment.
Step 5 – Deploy Prometheus stack
Add the Prometheus Helm repository and install the monitoring stack. The deployment creates:
- Prometheus StatefulSet with persistent storage
- Grafana deployment with LoadBalancer access
- Alertmanager for future alert configuration (optional)
- Supporting components (node exporters, kube-state-metrics)
# add Helm repository
helm repo add prometheus-community \
  https://prometheus-community.github.io/helm-charts
helm repo update

# install monitoring stack
helm install monitoring prometheus-community/kube-prometheus-stack \
  --namespace monitoring \
  --values values-prometheus.yaml \
  --wait
Then you can retrieve the LoadBalancer IP address to access Grafana:
kubectl get svc -n monitoring monitoring-grafanaFinally, open your browser to http://<EXTERNAL-IP> and login with:
- Username:
admin - Password: as configured in your
values-prometheus.yamlfile
Step 6 – Create Grafana dashboards
In this step, you will be able to access Grafana interface and add your Prometheus as a new data source, then create a complete dashboard with different vLLM metrics.
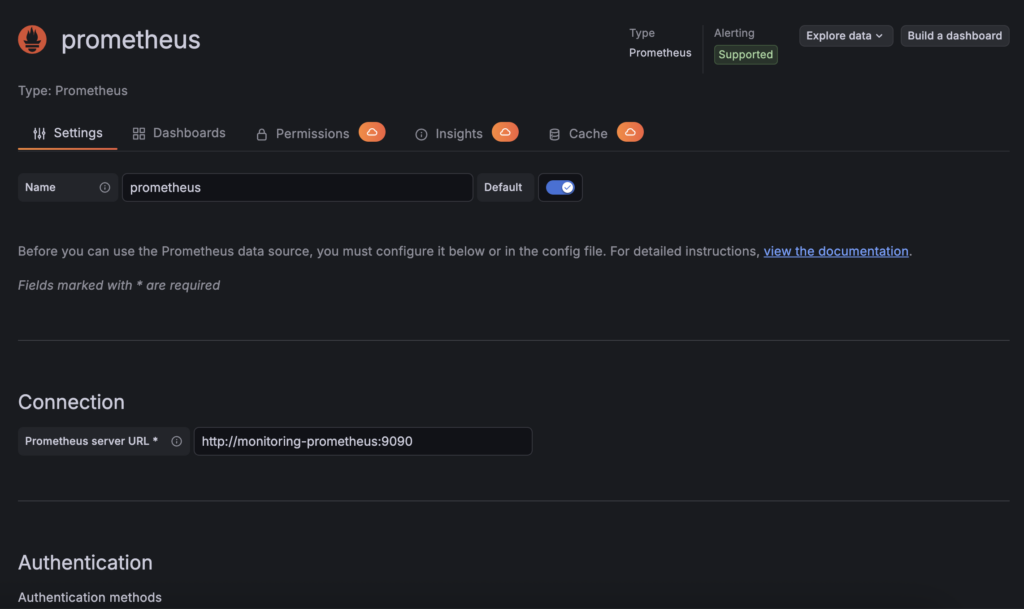
1. Add a new data source in Grafana
First of all, create a new Prometheus connection inside Grafana:
- Navigate to
Connections→Data sources→Add data source - Select Prometheus
- Configure URL:
http://monitoring-prometheus:9090 - Click Save & test
Now that your Prometheus has been configured as a new data source, you can create your Grafana dashboard.
2. Create your monitoring dashboard
To begin with, you can use the following pre-configured Grafana dashboard by downloading this JSON file locally:
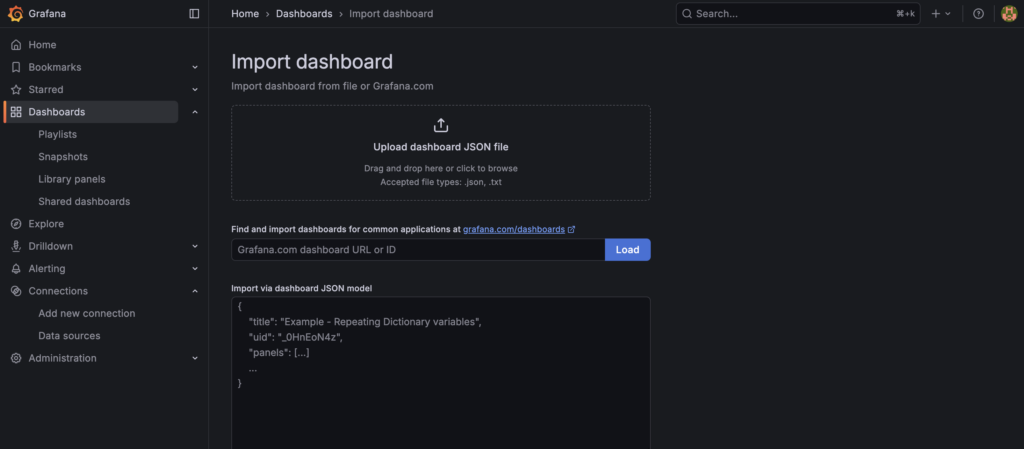
In the left-hand menu, select Dashboard:
- Navigate to
Dashboards→Import - Upload the provided dashboard JSON
- Select Prometheus as datasource
- Click Import and select the
vLLM-metrics-grafana-monitoring.jsonfile
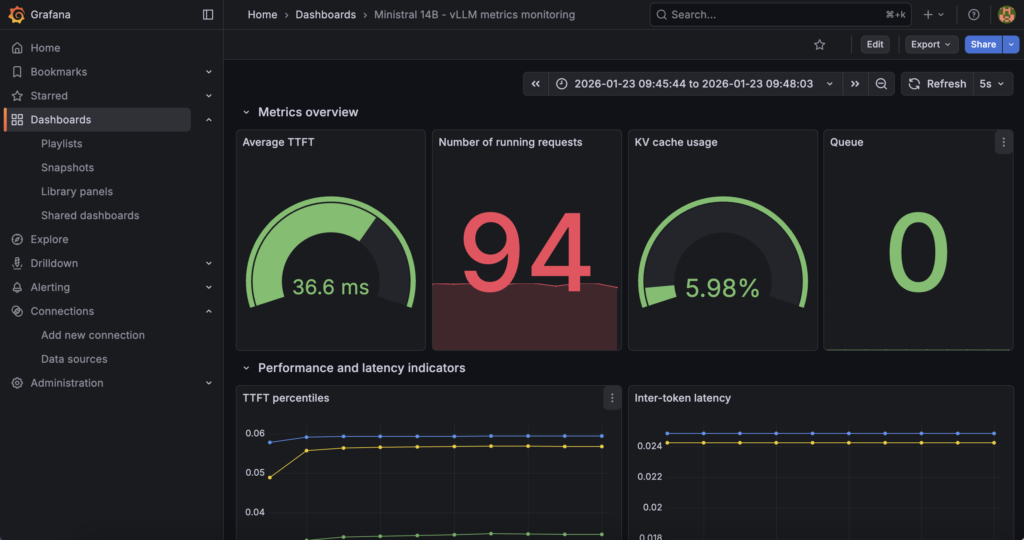
The dashboard provides real-time visibility for Ministral 3 14B deployed with vLLM container and OVHcloud AI Deploy.
You can now track:
- Performance metrics: TTFT, inter-token latency, end-to-end latency
- Throughput indicators: Requests per second, token generation rates
- Resource utilisation: KV cache usage, active/waiting requests
- Capacity indicators: Queue depth, preemption rates
Here are the key metrics tracked and displayed in the Grafana dashboard:
| Metric Category | Prometheus Metric | Description | Use case |
|---|---|---|---|
| Latency | vllm:time_to_first_token_seconds | Time until first token generation | User experience monitoring |
| Latency | vllm:inter_token_latency_seconds | Time between tokens | Throughput optimisation |
| Latency | vllm:e2e_request_latency_seconds | End-to-end request time | SLA monitoring |
| Throughput | vllm:request_success_total | Successful requests counter | Capacity planning |
| Resource | vllm:kv_cache_usage_perc | KV cache memory usage | Memory management |
| Queue | vllm:num_requests_running | Active requests | Load monitoring |
| Queue | vllm:num_requests_waiting | Queued requests | Overload detection |
| Capacity | vllm:num_preemptions_total | Request preemptions | Peak load indicator |
| Tokens | vllm:prompt_tokens_total | Input tokens processed | Usage analytics |
| Tokens | vllm:generation_tokens_total | Output tokens generated | Cost tracking |
Well done, you now have at your disposal:
- An endpoint of the Ministral 3 14B model deployed with vLLM thanks to OVHcloud AI Deploy and its autoscaling strategies based on custom metrics
- Prometheus for metrics collection and Grafana for visualisation/dashboards thanks to OVHcloud MKS
But how can you check that everything will work when the load increases?
Step 7 – Test autoscaling and real-time visualisation
The first objective here is to force AI Deploy to:
- Increase
vllm:num_requests_running - ‘Saturate’ a single replica
- Trigger the scale up
- Observe replica increase + latency drop
1. Autoscaling testing strategy
The goal is to combine:
- High concurrency
- Long prompts (KVcache heavy)
- Long generations
- Bursty load
This is what vLLM autoscaling actually reacts to.
To do so, a Python code can simulate the expected behaviour:
import time
import threading
import random
from statistics import mean
from openai import OpenAI
from tqdm import tqdm

APP_URL = "https://<APP_ID>.app.gra.ai.cloud.ovh.net/v1" # /!\ REPLACE THE <APP_ID> by yours /!\
MODEL = "mistralai/Ministral-3-14B-Instruct-2512"
API_KEY = $MY_OVHAI_ACCESS_TOKEN

CONCURRENT_WORKERS = 500          # concurrency (main scaling trigger)
REQUESTS_PER_WORKER = 25
MAX_TOKENS = 768                  # generation pressure

# some random prompts
SHORT_PROMPTS = [
    "Summarize the theory of relativity.",
    "Explain what a transformer model is.",
    "What is Kubernetes autoscaling?"
]

MEDIUM_PROMPTS = [
    "Explain how attention mechanisms work in transformer-based models, including self-attention and multi-head attention.",
    "Describe how vLLM manages KV cache and why it impacts inference performance."
]

LONG_PROMPTS = [
    "Write a very detailed technical explanation of how large language models perform inference, "
    "including tokenization, embedding lookup, transformer layers, attention computation, KV cache usage, "
    "GPU memory management, and how batching affects latency and throughput. Use examples.",
]

PROMPT_POOL = (
    SHORT_PROMPTS * 2 +
    MEDIUM_PROMPTS * 4 +
    LONG_PROMPTS * 6    # bias toward long prompts
)

# openai compliance
client = OpenAI(
    base_url=APP_URL,
    api_key=API_KEY,
)

# basic metrics
latencies = []
errors = 0
lock = threading.Lock()

# worker
def worker(worker_id):
    global errors
    for _ in range(REQUESTS_PER_WORKER):
        prompt = random.choice(PROMPT_POOL)

        start = time.time()
        try:
            client.chat.completions.create(
                model=MODEL,
                messages=[{"role": "user", "content": prompt}],
                max_tokens=MAX_TOKENS,
                temperature=0.7,
            )
            elapsed = time.time() - start

            with lock:
                latencies.append(elapsed)

        except Exception as e:
            with lock:
                errors += 1

# run
threads = []
start_time = time.time()

print("Starting autoscaling stress test...")
print(f"Concurrency: {CONCURRENT_WORKERS}")
print(f"Total requests: {CONCURRENT_WORKERS * REQUESTS_PER_WORKER}")

for i in range(CONCURRENT_WORKERS):
    t = threading.Thread(target=worker, args=(i,))
    t.start()
    threads.append(t)

for t in threads:
    t.join()

total_time = time.time() - start_time

# results
print("\n=== AUTOSCALING BENCH RESULTS ===")
print(f"Total requests sent: {len(latencies) + errors}")
print(f"Successful requests: {len(latencies)}")
print(f"Errors: {errors}")
print(f"Total wall time: {total_time:.2f}s")

if latencies:
    print(f"Avg latency: {mean(latencies):.2f}s")
    print(f"Min latency: {min(latencies):.2f}s")
    print(f"Max latency: {max(latencies):.2f}s")
    print(f"Throughput: {len(latencies)/total_time:.2f} req/s")
How can you verify that autoscaling is working and that the load is being handled correctly without latency skyrocketing?
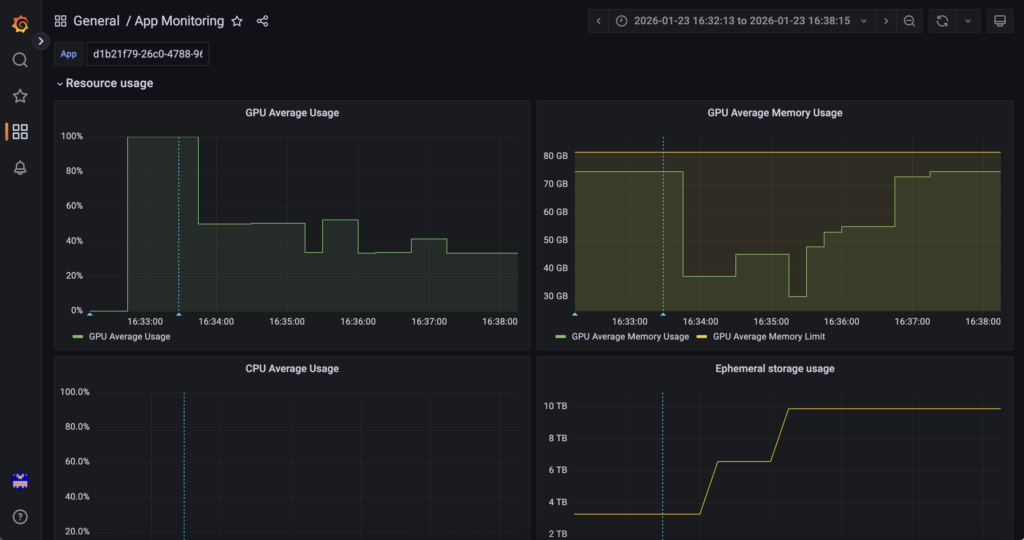
2. Hardware and platform-level monitoring
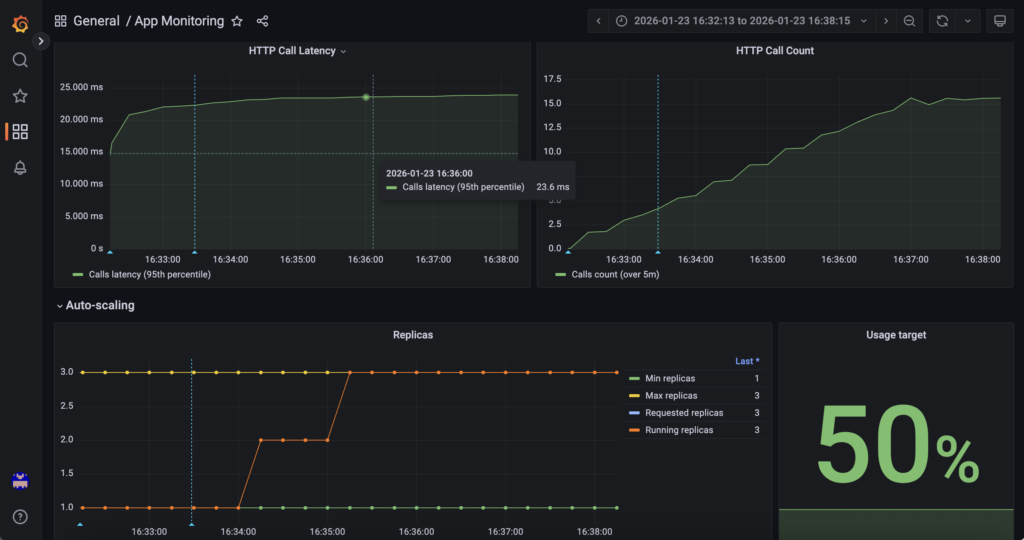
First, AI Deploy Grafana answers ‘What resources are being used and how many replicas exist?‘.
GPU utilisation, GPU memory, CPU, RAM and replica count are monitored through OVHcloud AI Deploy Grafana (monitoring URL), which exposes infrastructure and runtime metrics for the AI Deploy application. This layer provides visibility into resource saturation and scaling events managed by the AI Deploy platform itself.
Access it using the following URL (do not forget to replace <APP_ID> by yours): https://monitoring.gra.ai.cloud.ovh.net/d/app/app-monitoring?var-app=<APP_ID>&orgId=1
For example, check GPU/RAM metrics:
You can also monitor scale ups and downs in real time, as well as information on HTTP calls and much more!
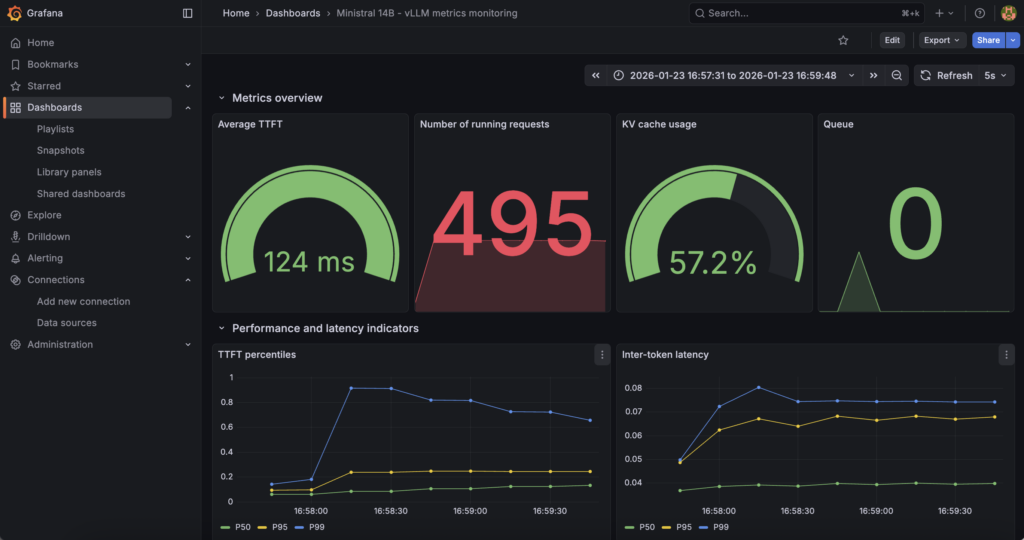
3. Software and application-level monitoring
Next the combination of MKS + Prometheus + Grafana answers ‘How the inference engine behaves internally’.
In fact, vLLM internal metrics (request concurrency, token throughput, latency indicators, KV cache pressure, etc.) are collected via the vLLM /metrics endpoint and scraped by Prometheus running on OVHcloud MKS, then visualised in a dedicated Grafana instance. This layer focuses on model behaviour and inference performance.
Find all these metrics via (just replace <EXTERNAL-IP>): http://<EXTERNAL-IP>/d/vllm-ministral-monitoring/ministral-14b-vllm-metrics-monitoring?orgId=1
Find key metrics such as TTF, etc:
You can also find some information about ‘Model load and throughput’:
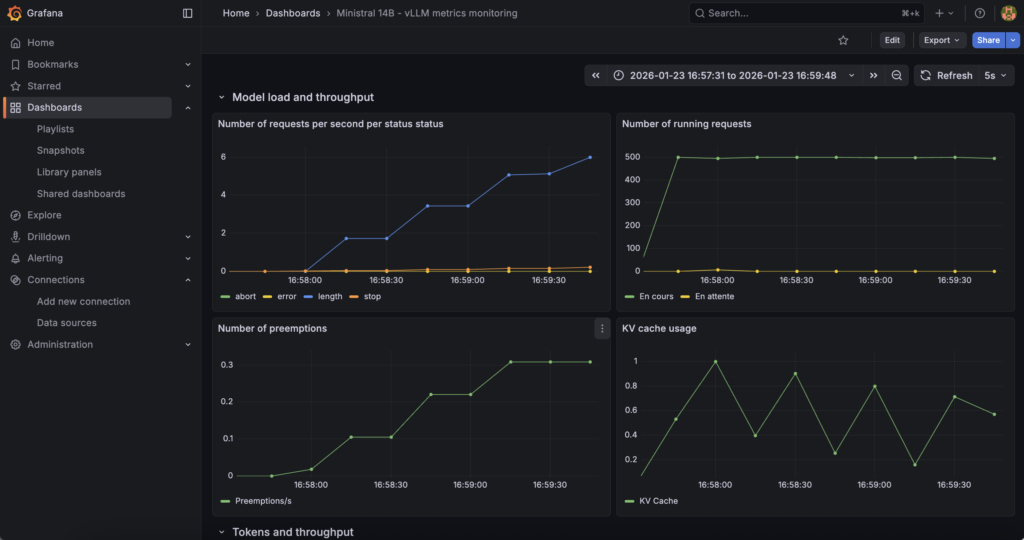
To go further and add even more metrics, you can refer to the vLLM documentation on ‘Prometheus and Grafana‘.
Conclusion
This reference architecture provides a scalable, and production-ready approach for deploying LLM inference on OVHcloud using AI Deploy and the autoscaling on custom metric feature.
OVHcloud MKS is dedicated to running Prometheus and Grafana, enabling secure scraping and visualisation of vLLM internal metrics exposed via the /metrics endpoint.
By scraping vLLM metrics securely from AI Deploy into Prometheus and exposing them through Grafana, the architecture provides full visibility into model behaviour, performance and load, enabling informed scaling analysis, troubleshooting and capacity planning in production environments.

Solution Architect @OVHcloud