Introduction
The underlying infrastructure of OVHcloud’s Cloud services consists of datacentres connected by a global telecommunication network which carries data to and from end users.
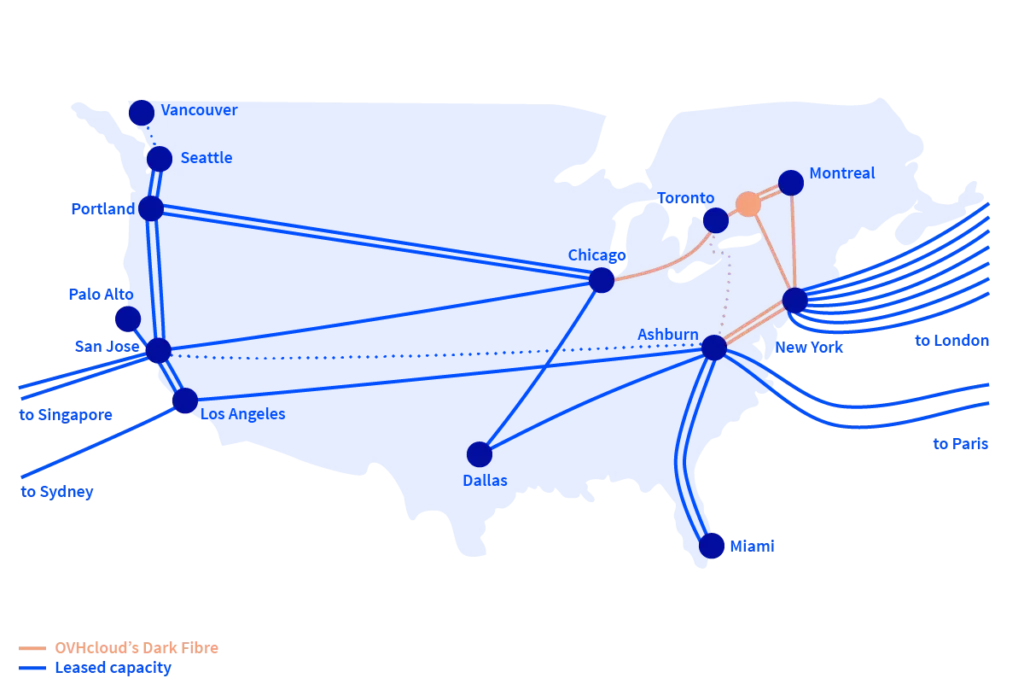
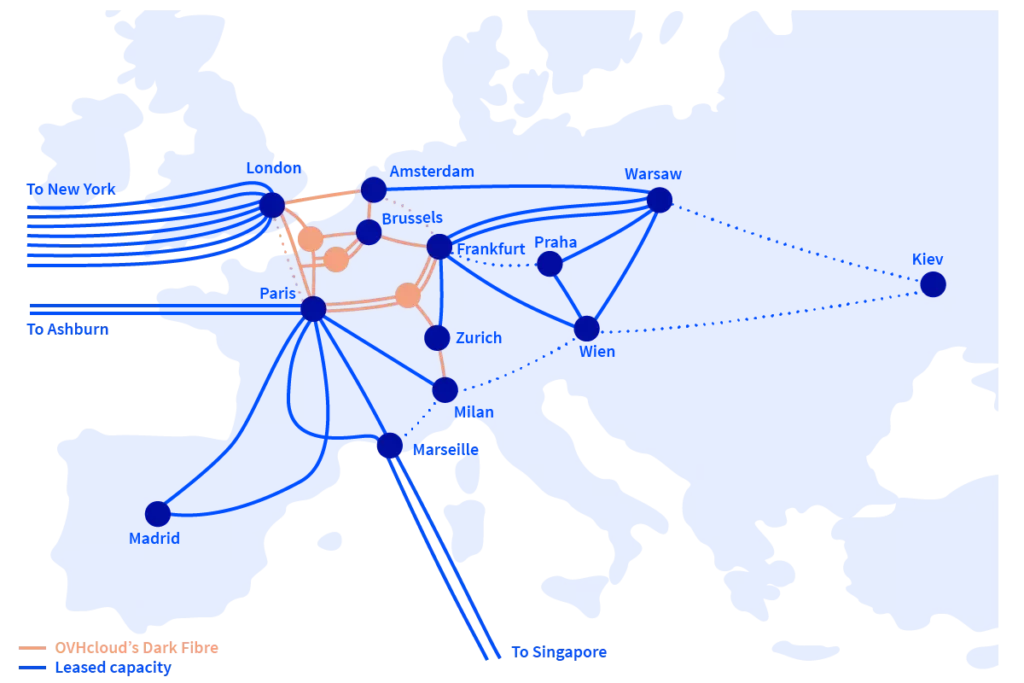
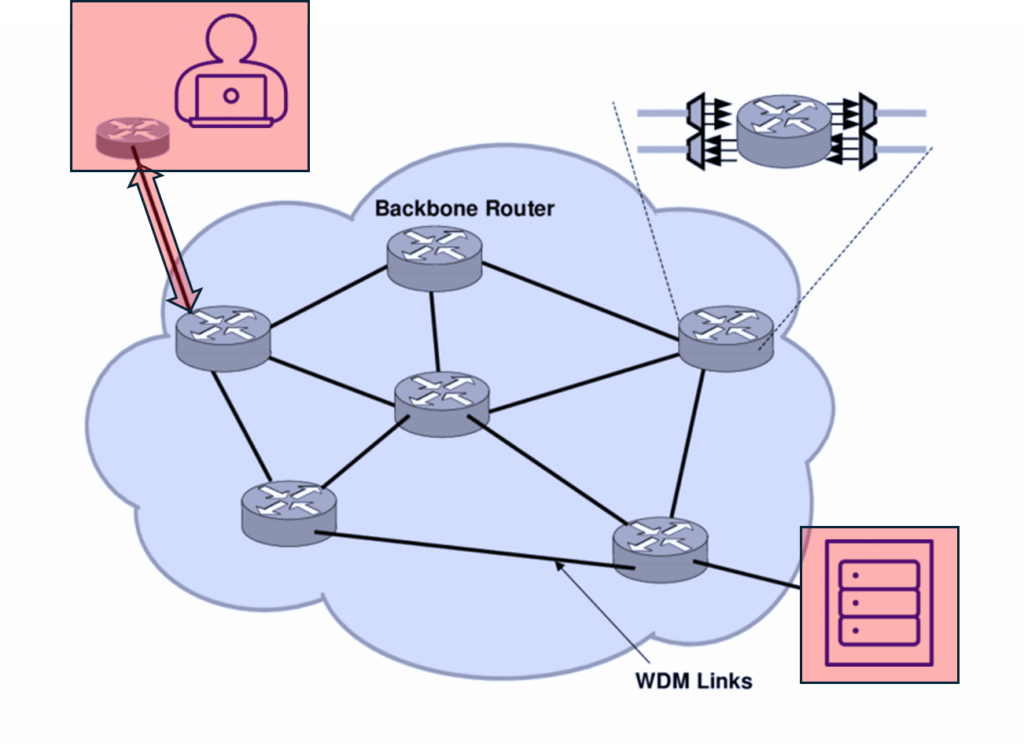
The core network (backbone) features nodes (also known as Points of Presence – PoPs) and long-distance/metropolitan spans (also known as links) which connect the nodes.
The PoPs are located in colocation facilities hosting optical transmission systems (Dense Wavelength Division Multiplexers – DWDM), IP routers, switches and servers.
The links are based on optical fibre routes interconnecting the PoPs and the datacentres, following a topology designed to maintain traffic in the event of multiple span cuts (for resiliency purposes). Two operating models are used:
- Operating model 1: OVHcloud owns the dark fibre cable or rents a pair of dark fibre cables (through long-term Indefeasible Right of Use – IRU) and operates its own DWDM systems to activate wavelengths (10, 100, 400 Gbps point-to-point transmission signals) on top of it.
- Operating model 2: OVHcloud leases the wavelengths activated by long-distance telecommunication operators on their international network (carrier’s carrier market).
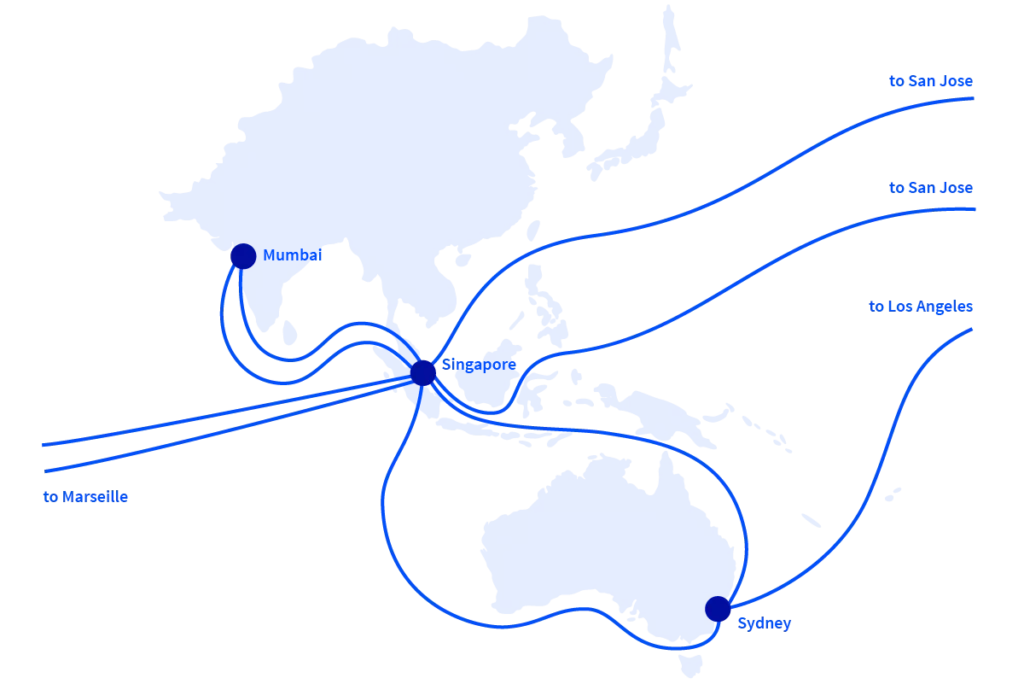
In this study, terrestrial and submarine transmission infrastructures are differentiated as their physical realities are dissimilar.
Scope of the study
Items covered by the study:
- POPs (colocation buildings and their technical environment)
- Fibre cables and their underlying infrastructure
- All active telecommunication equipment hosted in the PoPs as well as the line equipment hosted in amplification sites.
Items excluded by the model:
- OVHcloud datacentres network equipment (accounted for in OVHcloud datacentres’ impact inventory)
- ISP (Internet Service Providers) network as well as customer premises equipment.
Environmental impact of the PoPs
- Electricity consumption (use impact)
OVHcloud measures the electrical consumption of the PoP’s equipment, and of the technical environment of the colocation facility in which it is hosted. All the ancillary systems are taken into account, therefore the PUE (Power Usage Effectiveness) of the sites is de facto included in the model.
The impact factors (per kWh of electricity) are retrieved from the Ecoinvent database.
- Network equipment (manufacturing / distribution / end of life impacts)
OVHcloud reviews all the equipment deployed inside each PoP, including checking their commissioning date (for amortisation purposes).
The equipment reference is used to retrieve the impact factors from the Negaoctet and Resilio v2024.6 databases (amortised over six years). Should the exact model not be found, a similar generic reference is chosen.
- Facilities technical environment (manufacturing / distribution / use/end of life impacts)
Based on the electricity consumption of the technical environment of the colocation facility, the impact factors of each PoP (per contracted kW per year per kWh of electricity) are retrieved from the Ademe PCR datacentre and cloud database.
Environmental impact of the terrestrial links
- Optical fibre cable (manufacturing / distribution / end of life) impacts
Operating model 1: OVHcloud manages the transmission layer.
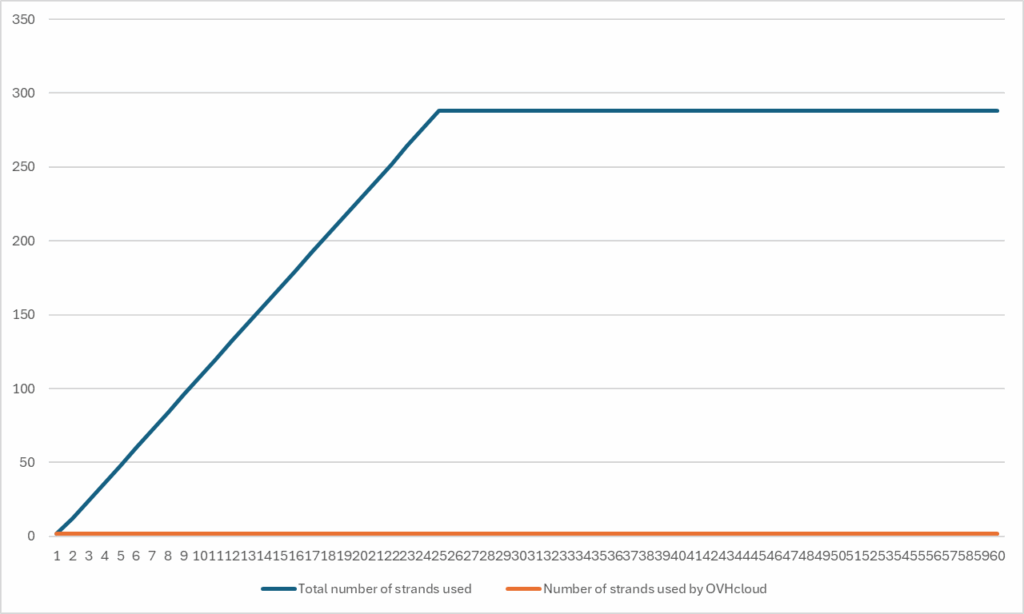
The optical fibre cable related impacts are calculated by allocating two strands out of a 288-strand cable. The allocation is then corrected to reflect the 25-year ramp-up before reaching 100% usage of the cable over a lifespan of 60 years. This leads to 0.88% of allocation.
The impact factors (per km) are retrieved from the Ecoinvent database.
Operating model 2: OVHcloud leases a wavelength to a carrier’s carrier.
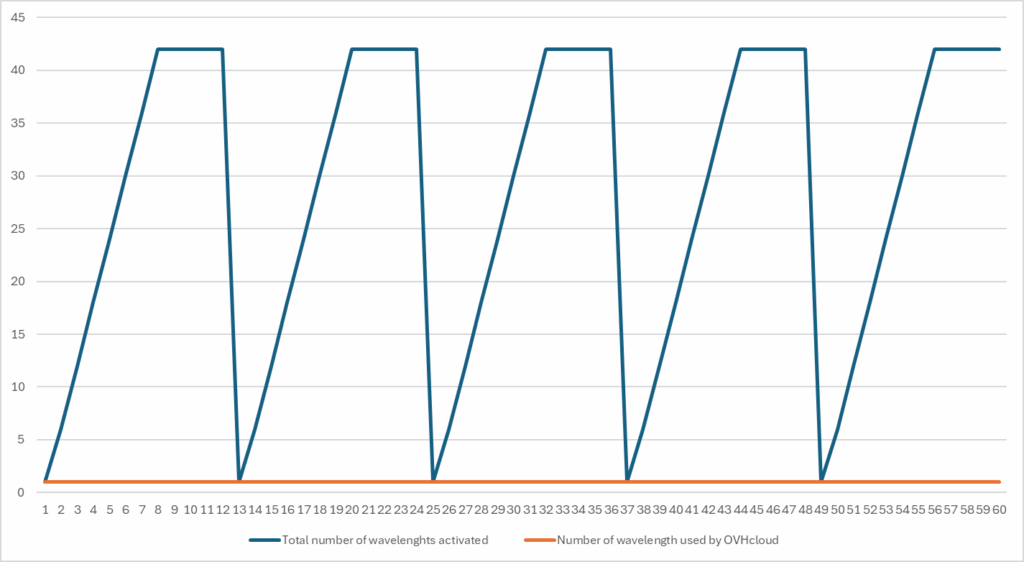
The assumption is that the carrier follows the same optical fibre cable allocation rules (0.88%). In addition, the impact is pro-rated considering the ramping up of the carrier’s optical systems (leading to 4.32% of 0.88% of allocation):
- Maximum number of channels per DWDM systems: 48
- Maximum load rate of DWDM systems: 85%
- Six-year ramp up to reach maximum load rate of the DWDM system
- DWDM system lifespan: 8 years
In both operating models, 10% of the civil work (trench, ducts) impacts necessary to lay the optical fibre cables are allocated.
- Line optical systems (manufacturing / distribution / use/end of life impacts)
Operating model 1: OVHcloud manages the transmission layer, therefore amplifier types and locations are known. (De)Multiplexers are excluded as they are already accounted for in the environmental impact of the PoPs (see previous section).
Operating model 2: OVHcloud leases a wavelength to a carrier’s carrier. The assumptions are as follows:
- (De)Multiplexers and repeaters are chosen using standard equipment
- Typical distance between two regenerator sites: 500 km
- Typical distance between two repeater sites: 90 km
- Maximum number of channels per DWDM systems: 48
- Maximum load rate of DWDM systems: 85%
- Six-year ramp up to reach maximum load rate of the DWDM system
- DWDM system lifespan: 8 years
Once the optical equipment mapping has been done, the emissions factors for each link are then retrieved from the Ademe ISP – Negaoctet database.
Environmental impact of the submarine links
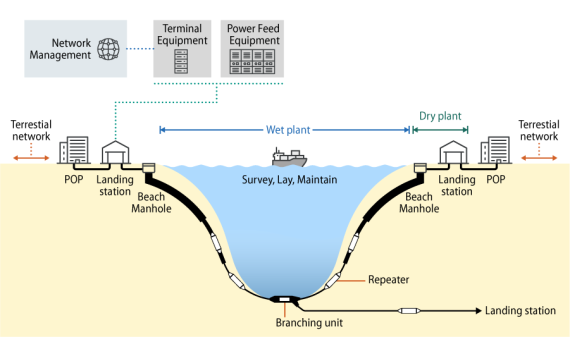
Submarine cable system (manufacturing / distribution / maintenance / end of life impacts) and electricity (use impact)
Operating model 2: OVHcloud leases a wavelength to a carrier’s carrier from PoP to PoP.
The climate change impact is retrieved from the 2025 Lisbon Suboptic study for both transatlantic and transpacific cable systems (per km and per year).
For the other impact factors (abiotic and water resources use), the submarine cable systems are modelled based on the following assumptions:
- (De)Multiplexers and repeaters are chosen using standard terrestrial equipment
- Cable is considered as a standard MV electrical cable
- Typical distance between two landing stations: 7000 km
- Typical distance between two repeaters: 80 km
- Maximum capacity: 200 Tbps for Transpacific / 350 Tbps for Transatlantic
- Maximum load rate of the DWDM systems: 100%
- Ten-year ramp up to reach Maximum load rate of the DWDM system
- Submarine cable system life span: 25 years
Results (per year)
| Impact ADPe | 58 kg Sb eq. |
| Impact GWP | 3700 tons CO2 eq. |
| Impact WU | 2.0E+06 m3 eq. |
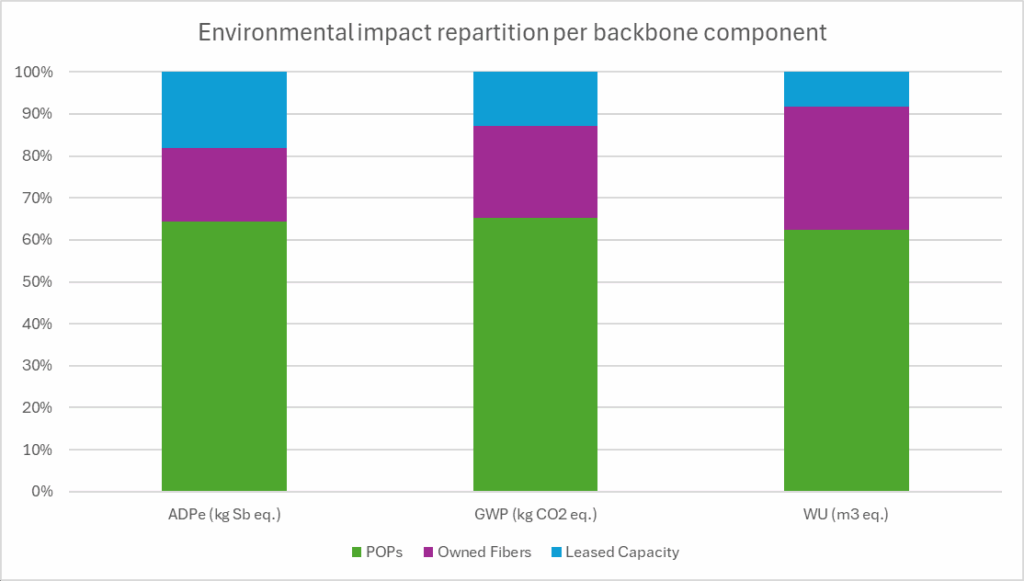
| Resource use, minerals and metals | Climate change | Water use | |
| ADPe (kg Sb eq.) | GWP (kg CO2 eq.) | WU (m3 eq.) | |
| POPs | 3.75E+01 | 2.42E+06 | 1.25E+06 |
| Owned Fibers | 1.02E+01 | 8.10E+05 | 5.87E+05 |
| Leased Capacity | 1.05E+01 | 4.73E+05 | 1.67E+05 |
| 5.81E+01 | 3.70E+06 | 2.00E+06 |
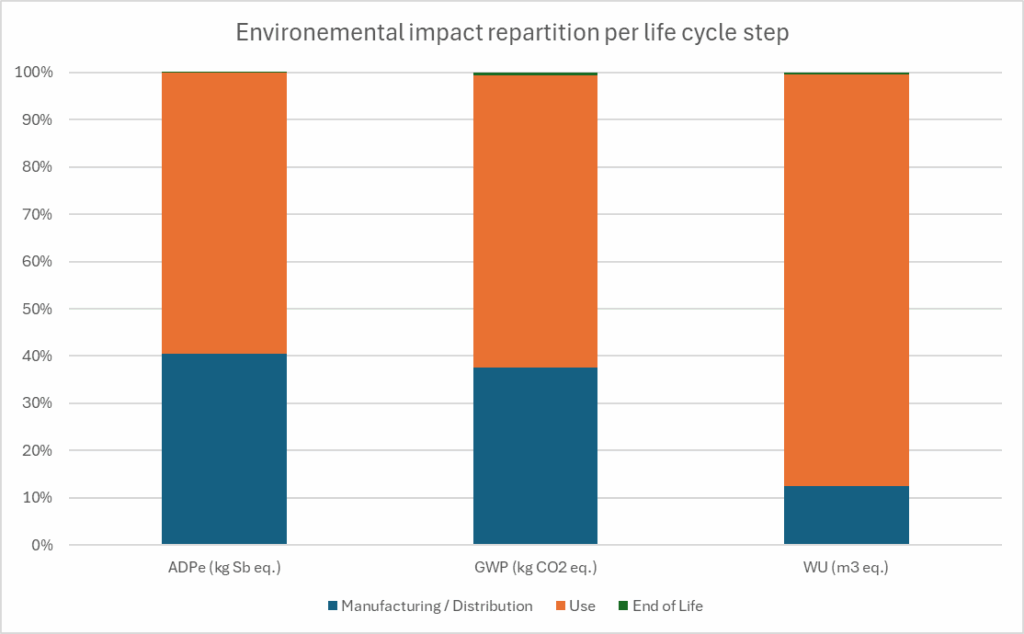
| Resource use, minerals and metals | Climate change | Water use | |
| ADPe (kg Sb eq.) | GWP (kg CO2 eq.) | WU (m3 eq.) | |
| Manufacturing / Distribution | 2.35E+01 | 1.39E+06 | 2.51E+05 |
| Use | 3.46E+01 | 2.29E+06 | 1.74E+06 |
| End of Life | 2.77E-03 | 2.31E+04 | 1.07E+04 |
| 5.81E+01 | 3.70E+06 | 2.00E+06 |
Conclusion
The above presented methodology allows to assess accurately the environmental impact of our backbone with a multi-factorial approach covering GHG emissions, water consumption and abiotic ressources usage. On the carbon emissions side, the findings are that the previous methodology we used (based on a Renater research paper) in our GHG emissions reporting was overestimating OVHcloud backbone impact by a factor 2.