Here @OVHCloud, we try to replace our legacy metrics oriented infrastructure. This infrastructure matters a lot for us as internal teams use it to supervise the core services of OVH, so before making any choices, we wanted to apply a bullet proof test to the challengers.
You can do two main things with a storage backend. You can write in it or you can read from it. That on the test of this last part we are focusing on today. We wanted our test to reproduce a production oriented scenario, let’s see how we build it.

In this blog post we wont cover the building of the underlying TSDB as it could apply to any of them as long as it ensure PromQL compatibility. We will also assume that you can write to the TSDB using Prometheus remote write protocol.
Now that we have our bench cluster up and running, we need to fill it up with data and this is the subject of the following part.
Let’s find some “real” data
As a cloud provider, all our solutions use compute instances wherever they are virtual or baremetal. One of our most common use case is to “look” at system server metrics through automatic recording rules or through Grafana dashboards. All this query are PromQL expressions.
To emulate our ingestion workflow, we deployed nodes exposing their metrics trough node exporter. We also charge couples of Prometheus to scrap them several time to emulate a large amount of host (several thousands of them). Those Prometheus are in charge of writing scrapped metrics to various backend we are benchmarking using remote write protocol.
After waiting several hours or day, our backend is full of data and we can move on. If you need more info on this subject, we have written another blog post about it.
It’s time to bench
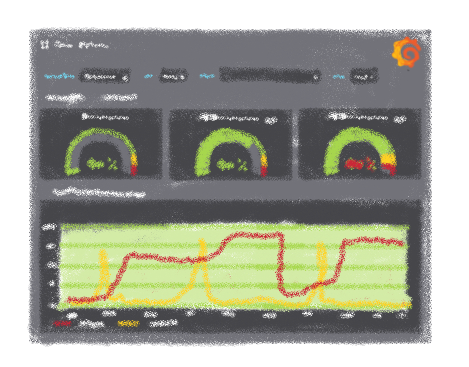
As we said it earlier, our read production workload has two components: automatic recording rules and Grafana dashboards. As our alerting system is not widely distributed, we won’t discuss it here, so let’s focus on the Grafana part. A dashboard is a collection of requests to execute against a backend, this is why we have extracted both range and instant the queries from one.
Once we have got this first result, we need a way to execute this request against the backend. As a PromQL request is mainly an HTTP call, we can use an http benchmark tool as a support for our test. One of the most widely used is Apache JMeter and this is the one we have used.

To fit into Apache JMeter who is not able to directly execute promQL request against a Prometheus compliant backend, the previously extracted series have been converted to a test plan. This tool takes various parameters, but three of them are quite important, the timestamp, the interval and the step that will apply to every query forwarded to the backend, just like you do when you submit a time frame to a dashboard in Grafana.
We are now able emulate the load of a dashboard with various time frame and extract meaningful information from this run as Apache Jmeter is a quite powerful tool. It allow us to use warm up period to exploit the benefice of cache or ramp up to study the response of our cluster when the load increase, loading always the same data or from new nodes.
For our first bench, we decided to go with the most widely use node exporter dashboard. We also identified time frame widely used (5m, 15m, 30m, 1h, 6h, 12h, 24h, 2d, 3d, 4d, 5d, 6d, 7d). Those are mainly the default time frame proposed by Grafana.
With the set of tools defined above, we identified three tests we wanted to make against each one of those time frame.
First test “Hot and cold storage”
A lot of solution use hot and cold storage sometimes also named short term storage and long term storage. With this test we want to identify the performances of those various layers.
As the purpose of this test is to check the response time of the various underlying storage, you may want to be sure to disable any cache that may alter the results.
Moreover, we do not want to test the saturation of the platform so we will emulate ten clients.
Second test “Caching performances”
This test is quite the opposite of the previous one. Here we want to test the response time of the TSB in the best possible scenario (data cached).
To get the best results from this test, we will use a warm-up period that will populate the various caches and then measure the response time of the TSDB.
Once again, in this test, we do not want to test the saturation of the platform so we will emulate ten clients.
Third test “Filling up the cache”
The purpose of this last bench is to test the saturation of the platform. Here we will use a ramp-up, adding more and more client to the test over a defined period of time and check the according errors and response time of the underlying platform.
At a certain point, we should see that the platform is not able to handle anymore clients. We assume this number of client will differ with the lookup time frame.
Conclusion
The benchmark concluded to two expected conclusions.
- Some support of data are way more faster than other (Memory is faster than local disk which is faster than a distant object storage).
- The use of the various caches proposed is a game changer.
It’s time for a second conclusion
Our approach of the benchmark is quite interesting as it aims to emulate the more precisely our production workload. You may be wondering where do we store this wonderful collection of tools. Well, here is the truth, maybe those tool don’t need to be shared and for several reasons:
- The result of the test widely depends of the data stored inside the TSDB, which is the result of another procedure and is difficult to reproduce. That leads to a result that is subject to interpretation
- The tooling is difficult to use and time consuming
- Just like the time flies, the truth of today is not the one of tomorrow and your production reality of today will probably be quite different from the one to come
- We like to fight against the not invented here syndrome
In consequence, we need a tool more convenient to use, ideally used by others and with a more reproducible pattern to bench. We will discuss how we should have benchmarked our remote storage in the next blog post.
System engineer at OVHcloud
